Relative Strength Line v1.3
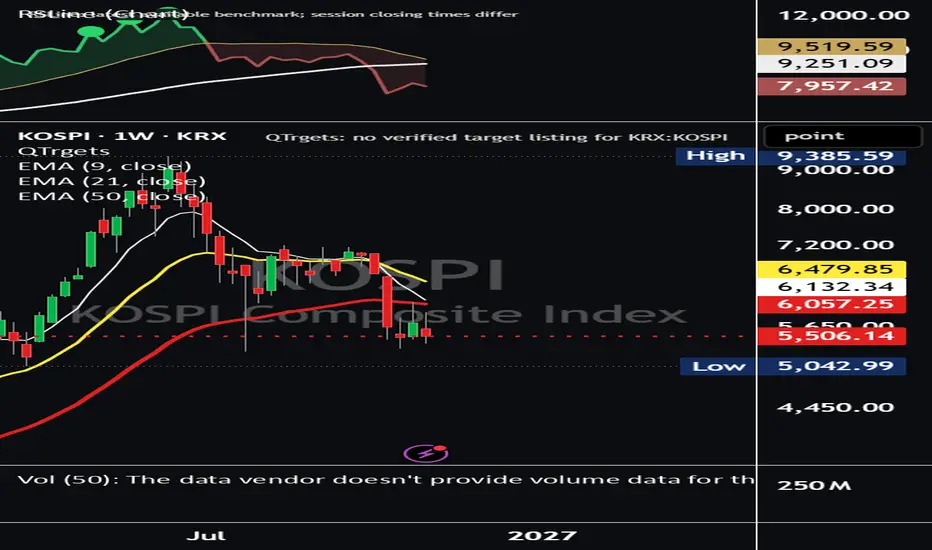
RSLine measures a stock’s performance relative to a chosen benchmark, with QQQ as the default. A rising line indicates outperformance; a falling line indicates underperformance.
Includes adjustable moving averages, green/red trend shading and new-high markers:
- **Green:** RS and price both exceed their previous lookback highs.
- **Purple:** RS exceeds its previous high while price has yet to exceed its own.
Calculate Daily, Weekly or Monthly RS independently of your chart timeframe. An optional table displays relative returns across multiple periods. Dots confirm after both the selected RS period and chart candle close.
Designed for standard Daily, Weekly and Monthly charts.
Includes adjustable moving averages, green/red trend shading and new-high markers:
- **Green:** RS and price both exceed their previous lookback highs.
- **Purple:** RS exceeds its previous high while price has yet to exceed its own.
Calculate Daily, Weekly or Monthly RS independently of your chart timeframe. An optional table displays relative returns across multiple periods. Dots confirm after both the selected RS period and chart candle close.
Designed for standard Daily, Weekly and Monthly charts.

@StocksMathPoker on X
1amInvesting.com
1amInvesting.com
免责声明
这些信息和出版物并非旨在提供,也不构成TradingView提供或认可的任何形式的财务、投资、交易或其他类型的建议或推荐。请阅读使用条款了解更多信息。
@StocksMathPoker on X
1amInvesting.com
1amInvesting.com
免责声明
这些信息和出版物并非旨在提供,也不构成TradingView提供或认可的任何形式的财务、投资、交易或其他类型的建议或推荐。请阅读使用条款了解更多信息。