OPEN-SOURCE SCRIPT
已更新 HTF Candles & Mini Charts by DGT
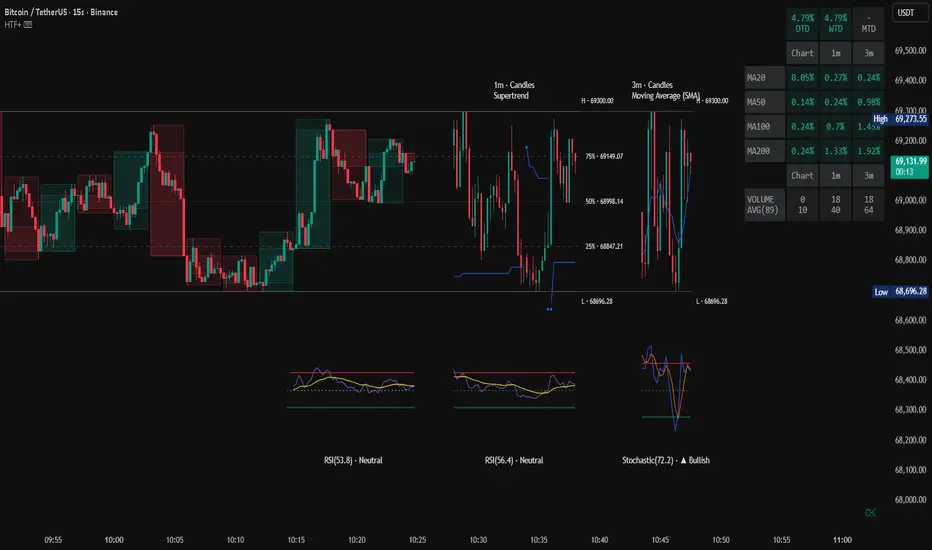
HTF Candles & Mini Charts is a multi-timeframe visualization tool designed to help traders monitor higher-timeframe market structure without leaving their current chart.
The indicator overlays higher-timeframe candles directly onto the active chart while also introducing compact mini HTF charts that display compressed higher-timeframe price action. This allows traders to observe broader market context while executing trades on lower timeframes.
By combining higher-timeframe overlays, mini charts, technical indicators, volume-weighted coloring, reference levels, oscillators, and statistical panels, the script provides a powerful environment for analyzing price structure across multiple timeframes simultaneously.
KEY FEATURES
⯌ HTF Chart Overlay (Main Price Chart)
⯌ Mini HTF Charts
⯌ Technical Indicators & Oscillators
⯌ Range Reference Levels
⯌ Volume-Weighted Candle Coloring
⯌ Statistics Panel
WHY USE HTF ANALYSIS
DISCLAIMER
The indicator overlays higher-timeframe candles directly onto the active chart while also introducing compact mini HTF charts that display compressed higher-timeframe price action. This allows traders to observe broader market context while executing trades on lower timeframes.
By combining higher-timeframe overlays, mini charts, technical indicators, volume-weighted coloring, reference levels, oscillators, and statistical panels, the script provides a powerful environment for analyzing price structure across multiple timeframes simultaneously.
KEY FEATURES
⯌ HTF Chart Overlay (Main Price Chart)
Displays higher-timeframe candles directly on the chart, allowing traders to see how lower-timeframe price action evolves within a higher-timeframe structure.
Features:
- Multiple chart styles: Candles, High–Low, Heikin Ashi
- Support for two independent HTF overlays
- Optional volume-weighted candle coloring based on relative trading activity
This allows traders to visualize higher-timeframe price development without switching charts.
⯌ Mini HTF Charts
Compact higher-timeframe charts displayed beside the main chart provide a quick snapshot of broader market structure and price development. Mini charts allow traders to quickly monitor trend direction and higher-timeframe context while focusing on lower-timeframe execution.
Features:
- Multiple chart styles: Candles, High–Low, Heikin Ashi
- Integrated technical indicators and oscillators
- Reference range levels
- Volume-weighted candle coloring
⯌ Technical Indicators & Oscillators
A selection of commonly used indicators can be displayed on the main chart and mini charts to help evaluate trend strength, volatility, and momentum.
Trend / Volatility indicators:Momentum oscillators:
- Moving Average
- Bollinger Bands
- Supertrend
- RSI
- Stochastic
These indicators help traders quickly evaluate trend conditions and momentum across timeframes.
⯌ Range Reference Levels
Statistical reference levels derived from the higher-timeframe range help traders quickly assess where price sits within the broader range structure.
Available levels:
- Range High / Low
- Range Quartiles (25%, 50%, 75%)
These levels provide a clear representation of range distribution.
⯌ Volume-Weighted Candle Coloring
Candles can optionally be colored based on relative volume participation, highlighting periods of strong or weak trading activity. This visual cue helps identify moments when market participation significantly increases or decreases.
⯌ Statistics Panel
An optional statistics panel provides quick insights into price performance across multiple time horizons
Included metrics:
- Performance Metrics
- Distance to Key Moving Averages
- Volume Participation
WHY USE HTF ANALYSIS
Markets move in fractal structures where lower-timeframe price action constantly reacts to higher-timeframe levels and trends.
Using higher-timeframe overlays helps traders:
- Understand broader trend direction
- Identify key range boundaries
- Avoid trading directly into higher-timeframe resistance or support
- Align lower-timeframe entries with higher-timeframe structure
DISCLAIMER
This script is intended for informational and educational purposes only. It does not constitute financial, investment, or trading advice. All trading decisions made based on its output are solely the responsibility of the user.
版本注释
Inspired by TradingView's Watermark publication, added my logo :)版本注释
a tweak 版本注释
added some performance statistics please note, values presented reflects the value from the beginning of the month, week, year etc, not for a month, a week etc long duration
版本注释
updatemade htf candle color and transparency adjustable, thanks to new pine update
added optional fixed moving average display for both current time frame and selected higher time frame
版本注释
typo correction版本注释
update * enchanced statistical panel with multi time frame price distance to its MA (convergance/divergence) statistical info
* new color function made style coloring disappeared, so added them into the script options
* time frame selection for htf candle and ma's are now separated
版本注释
Added ability to display Heikin-Ashi CandlesThe Heikin-Ashi technique averages price data to construct the chart where the formula for calculating each bar is different than standard candlestick charts. Heikin-Ashi chart is smoother (market noise filtered out) and easier to spot trends and reversals
Basics of how to interpret Heikin-Ashi candles
• Green candles signify an uptrend and if no lower "shadows" then a strong uptrend
• Candles with a small body surrounded by upper and lower shadows indicate a trend change
• Red candles indicate a downtrend and if no higher shadows then a strong downtrend
Day traders who need to exploit quick price moves may find Heikin-Ashi charts are not responsive enough to be useful
版本注释
quick update - added 15 Min TimeFrame option both for HTF Candle and Moving Average版本注释
typo fix版本注释
update* added ability to plot second higher timeframe candle
* added ability to set alerts whenever new high/low detected on higher timeframe (both 1st and 2nd htf candle)
* added volume and volume average stats to info panel
版本注释
updateadded higher time frame mini charts
special thnaks to berkusacoin
版本注释
option added to enable/disable of current and higher time frame moving averages independently版本注释
UpdateMini Charts
- are now available for all markets (due to Pine limitations it used to be only properly applicable on 7/24 open markets, thanks to Pine Team for the recent update that allow us to apply the concept on all markets)
- ability to specify number of bars (min 1, max 9)
- each bar includes OHLC info, Range and ATR Value (just hover over the each bar’s top). Additionally when high volatility is detected “⚡” sing will appear on top of the bar.
- Ability to display assistant lines either displaying the Range or including the range as Fibonacci levels
special thanks to berkusacoin for his valuable suggestion
Alerts
- Extended to include Moving Average crosses (Previously only HTF HIGH and LOW detection was available)
版本注释
a quick update, thnaks to Arun_K_Bhaskar版本注释
updateadded 5-period simple moving average for mini charts, Prakarti31 thanks alot for the suggestion
added ability to change test size of labels of assistant lines
htf selection extended, now 3m, 5m and 10m are availabe
版本注释
New indicator aditions - Volume Weighted Colored Bars
- Mini Overlay RSI Indicator, including higher timeframe mini charts. Thnaks to Prakarti31 valuable suggestion
- Forex Market Sessions
版本注释
bug correction thanks to Prakarti31 valuable analysis - mini overlay RSI indicator display, updates correctly in real-time for htf candles as well版本注释
feature update - hard coded sma(close, 5) for htf mini charts replaced with fully customizable version. users may specify type of the moving average ("SMA", "EMA", "RMA", "WMA", "VWMA"), source and length according to their needs
assitance lines - reverse fib levels are added as another option
版本注释
update* refactored mini charts code, enhanced and extended htf mini charts
* new : candlestick pattern detection, please check here for chart version with trend options
* improved statistical panel
* extended alerts
* removed Forex Market Sessions display
版本注释
MAJOR UPDATE — FULL ENGINE RE-ARCHITECTUREThis release introduces a complete internal redesign of the HTF Candles & Mini Charts engine, rebuilt using Pine Script® v6 architecture and modern object-based rendering.
The update focuses on improving performance, flexibility, and visual consistency while preserving the original concept of multi-timeframe visualization directly on the chart.
Key Improvements
- Fully re-engineered HTF data collection and processing pipeline
- Redesigned Mini HTF Chart engine with improved rendering performance
- Dynamic timeframe resolution handling for consistent multi-timeframe behavior
- Expanded technical overlay framework (Supertrend, Bollinger Bands, Moving Averages)
- Integrated oscillator modules (RSI and Stochastic) for both mini charts and the main chart
- Enhanced volume-weighted candle logic for improved activity detection
- Improved statistical performance panel with refined layout and calculations
- More efficient lookback management and object lifecycle handling
Community Thanks
Special thanks to the community members who provided constructive feedback over time. Several refinements and structural improvements in this evolution were inspired directly by thoughtful user input.
Your engagement helped shape this upgrade.
开源脚本
秉承TradingView的精神,该脚本的作者将其开源,以便交易者可以查看和验证其功能。向作者致敬!您可以免费使用该脚本,但请记住,重新发布代码须遵守我们的网站规则。

SoleMare Analytics | MarketMastery™ Tools | Exclusively on TradingView
免责声明
这些信息和出版物并非旨在提供,也不构成TradingView提供或认可的任何形式的财务、投资、交易或其他类型的建议或推荐。请阅读使用条款了解更多信息。
开源脚本
秉承TradingView的精神,该脚本的作者将其开源,以便交易者可以查看和验证其功能。向作者致敬!您可以免费使用该脚本,但请记住,重新发布代码须遵守我们的网站规则。
免责声明
这些信息和出版物并非旨在提供,也不构成TradingView提供或认可的任何形式的财务、投资、交易或其他类型的建议或推荐。请阅读使用条款了解更多信息。