OPEN-SOURCE SCRIPT
SRJ India VIX Widget
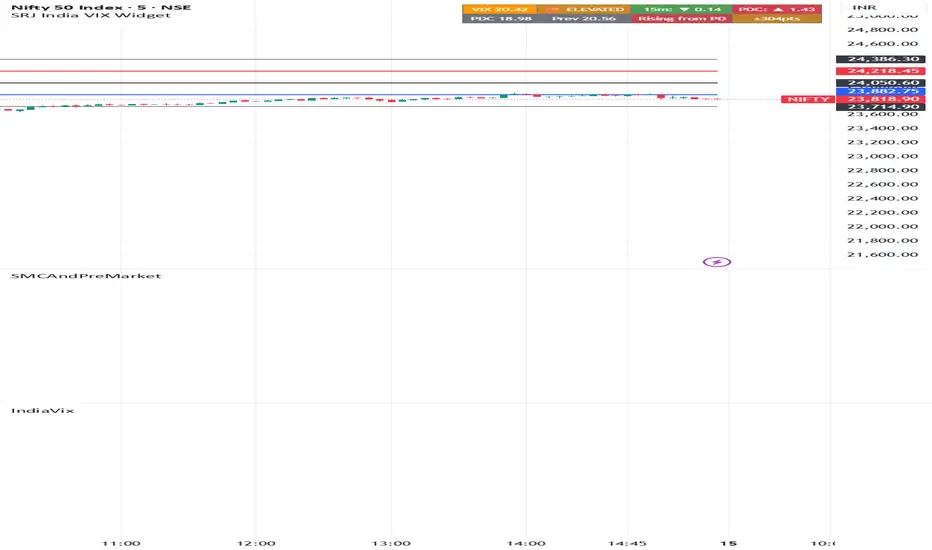
**SRJ India VIX Widget – Volatility Regime & Expected Range Tool**
The SRJ India VIX Widget combines real-time volatility regime tracking with a custom expected range model to support intraday planning and risk management for Indian index traders.
This indicator uses India VIX to estimate potential daily movement and plots volatility-adjusted levels around the previous day’s close. It also includes a live dashboard that tracks volatility shifts and short-term changes throughout the session.
**🔹 What it shows**
* Live VIX value with regime classification
* Change vs previous 15-minute interval and previous day close
* Volatility-based expected range levels
* Extended range bands for potential expansion scenarios
**🔹 How to use**
* Use the range bands as dynamic support and resistance zones
* Rising VIX indicates increasing volatility and possible trend expansion
* Falling VIX suggests compression and range-bound conditions
* Helps define intraday bias, targets, and risk levels
**🔹 Best suited for**
* Index intraday traders
* Volatility-based trading strategies
* Traders seeking objective, data-driven reference levels
**🔹Multi-use behavior**
On NSE indices: Displays both volatility dashboard and expected range levels
On other symbols (stocks, crypto, etc.): Works as a standalone India VIX dashboard for broader market context
**⚠️ Notes**
* Expected range levels are available only on supported NSE indices due to India VIX dependency
* These levels are statistical estimates and should not be treated as fixed support/resistance
**Disclaimer**
This script is an independent implementation combining volatility regime analysis with a custom expected range model.
The concept of volatility-based expected move estimation is widely used in financial markets; this indicator provides a structured adaptation with additional logic, visualization, and intraday context.
The SRJ India VIX Widget combines real-time volatility regime tracking with a custom expected range model to support intraday planning and risk management for Indian index traders.
This indicator uses India VIX to estimate potential daily movement and plots volatility-adjusted levels around the previous day’s close. It also includes a live dashboard that tracks volatility shifts and short-term changes throughout the session.
**🔹 What it shows**
* Live VIX value with regime classification
* Change vs previous 15-minute interval and previous day close
* Volatility-based expected range levels
* Extended range bands for potential expansion scenarios
**🔹 How to use**
* Use the range bands as dynamic support and resistance zones
* Rising VIX indicates increasing volatility and possible trend expansion
* Falling VIX suggests compression and range-bound conditions
* Helps define intraday bias, targets, and risk levels
**🔹 Best suited for**
* Index intraday traders
* Volatility-based trading strategies
* Traders seeking objective, data-driven reference levels
**🔹Multi-use behavior**
On NSE indices: Displays both volatility dashboard and expected range levels
On other symbols (stocks, crypto, etc.): Works as a standalone India VIX dashboard for broader market context
**⚠️ Notes**
* Expected range levels are available only on supported NSE indices due to India VIX dependency
* These levels are statistical estimates and should not be treated as fixed support/resistance
**Disclaimer**
This script is an independent implementation combining volatility regime analysis with a custom expected range model.
The concept of volatility-based expected move estimation is widely used in financial markets; this indicator provides a structured adaptation with additional logic, visualization, and intraday context.
开源脚本
秉承TradingView的精神,该脚本的作者将其开源,以便交易者可以查看和验证其功能。向作者致敬!您可以免费使用该脚本,但请记住,重新发布代码须遵守我们的网站规则。

免责声明
这些信息和出版物并非旨在提供,也不构成TradingView提供或认可的任何形式的财务、投资、交易或其他类型的建议或推荐。请阅读使用条款了解更多信息。
开源脚本
秉承TradingView的精神,该脚本的作者将其开源,以便交易者可以查看和验证其功能。向作者致敬!您可以免费使用该脚本,但请记住,重新发布代码须遵守我们的网站规则。
免责声明
这些信息和出版物并非旨在提供,也不构成TradingView提供或认可的任何形式的财务、投资、交易或其他类型的建议或推荐。请阅读使用条款了解更多信息。