OPEN-SOURCE SCRIPT
The Setup Factory Short-Term Extension
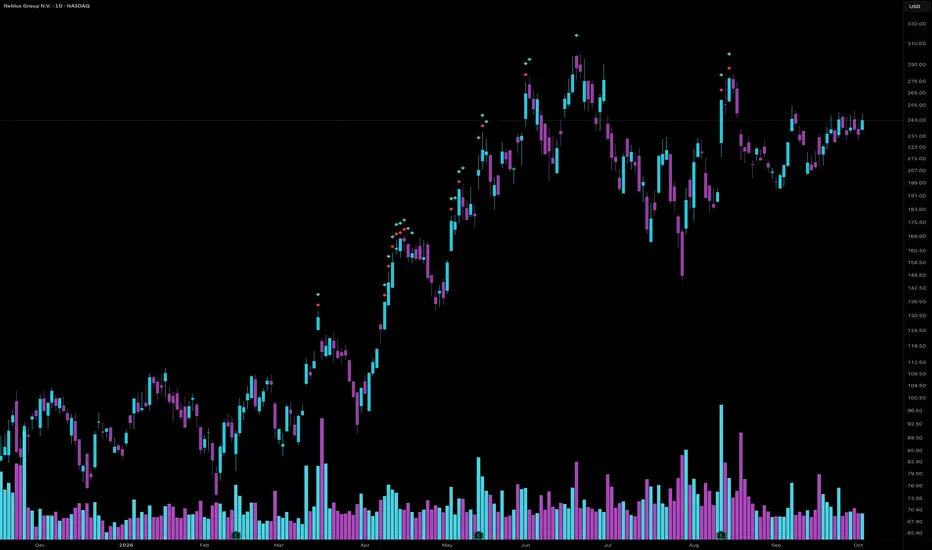
The Setup Factory Short-Term Extension
This indicator marks the bars where a stock's close is stretched far above its short-term moving averages, measured in ATRs. It shows two levels of extension, one against the 9 EMA and one against the 21 EMA.
WHAT IT SHOWS
- Red marker: the close is 2 or more ATRs above the 9 EMA.
- Teal marker: the close is 2.5 or more ATRs above the 21 EMA. When both apply, the teal marker sits above the red one.
- Only extension to the upside is marked.
HOW IT IS CALCULATED
The distance of the close above the EMA, as a percentage of the EMA, is divided by the ATR(14) as a percentage of the close:
Extension = ((Close - EMA) / EMA) / (ATR / Close)
A marker appears when that value reaches the threshold for its EMA.
HOW TO USE IT
Use the markers to see when a move has become stretched in the short term, for example before adding to a position or when deciding whether to take some profit into strength. The markers describe how extended price is. They are not buy or sell signals. A marker on the current bar is final once the bar closes.
SETTINGS
Each marker can be switched on or off, and its EMA length, ATR threshold, colour and shape can be changed. The ATR length can also be changed.
This is the extension formula and calibration used in The Setup Factory's own tools, published as one fixed standard. All rules it applies are stated above.
This indicator marks the bars where a stock's close is stretched far above its short-term moving averages, measured in ATRs. It shows two levels of extension, one against the 9 EMA and one against the 21 EMA.
WHAT IT SHOWS
- Red marker: the close is 2 or more ATRs above the 9 EMA.
- Teal marker: the close is 2.5 or more ATRs above the 21 EMA. When both apply, the teal marker sits above the red one.
- Only extension to the upside is marked.
HOW IT IS CALCULATED
The distance of the close above the EMA, as a percentage of the EMA, is divided by the ATR(14) as a percentage of the close:
Extension = ((Close - EMA) / EMA) / (ATR / Close)
A marker appears when that value reaches the threshold for its EMA.
HOW TO USE IT
Use the markers to see when a move has become stretched in the short term, for example before adding to a position or when deciding whether to take some profit into strength. The markers describe how extended price is. They are not buy or sell signals. A marker on the current bar is final once the bar closes.
SETTINGS
Each marker can be switched on or off, and its EMA length, ATR threshold, colour and shape can be changed. The ATR length can also be changed.
This is the extension formula and calibration used in The Setup Factory's own tools, published as one fixed standard. All rules it applies are stated above.
开源脚本
秉承TradingView的精神,该脚本的作者将其开源,以便交易者可以查看和验证其功能。向作者致敬!您可以免费使用该脚本,但请记住,重新发布代码须遵守我们的网站规则。

免责声明
这些信息和出版物并非旨在提供,也不构成TradingView提供或认可的任何形式的财务、投资、交易或其他类型的建议或推荐。请阅读使用条款了解更多信息。
开源脚本
秉承TradingView的精神,该脚本的作者将其开源,以便交易者可以查看和验证其功能。向作者致敬!您可以免费使用该脚本,但请记住,重新发布代码须遵守我们的网站规则。
免责声明
这些信息和出版物并非旨在提供,也不构成TradingView提供或认可的任何形式的财务、投资、交易或其他类型的建议或推荐。请阅读使用条款了解更多信息。