OPEN-SOURCE SCRIPT
Undertow [vole]
OVERVIEW
Undertow looks at who is moving price rather than where price is going. It keeps two volume readings apart: the crowd, read on the loud bars where volume expands, and the quiet money, read on the calm bars where volume contracts. The upside event is the bar on which the quiet side turns decisively up while the crowd is still on the selling side. The downside event is the mirror and is off by default. The core computation follows the Koncorde indicator on TradingView, credited to its author.
HOW IT WORKS
Bar by bar, the indicator builds two running price indices. One moves only on bars where volume rises compared with the bar before, which is the crowd. The other moves only on bars where volume falls, which is the quiet money. Each is compared with its own smoothed average and scaled to its recent range. The crowd reading is then added to a blended trend reading made from a momentum measure, a volume-weighted momentum measure, the position of price inside a wide band and a stochastic position. The upside event is registered when the quiet reading crosses above the average of the trend reading while it is already positive and the crowd reading is still negative. The downside event needs the quiet reading to cross below zero while the crowd is above both the trend reading and its average. Three filters thin the reports. The strength filter asks the quiet reading to be below the trend average on the downside. The candle filter asks the bar to close in the event's direction. The position guard keeps a side quiet after it has fired until the other side fires. A profile sets how much history is weighed. Where a chart carries no volume, the bar's own range is used instead.

An L marker on a 15m Bitcoin chart, on the bar where the quiet side of volume turns up while the crowd is still selling.
WHAT YOU'LL SEE ON THE CHART

The same marker on a 15m Ethereum chart. Events are reported rarely, with long quiet stretches between markers.
BEST FOR
Markets: Crypto, US Stocks, Commodity.
Timeframes: Crypto 15m–1D; US Stocks 1h–1D; Commodity 1h.
ALERTS
OPEN SOURCE
The source code is open and published under the Mozilla Public License 2.0, so it can be read, checked and reused under those terms.
CREDIT
The core computation follows Koncorde by Blai5, as published on TradingView by manboto. This script is a separate adaptation: it keeps the crowd and quiet-money readings apart and reports one event per state change.
ACCESS
Free, open-source script.
DISCLAIMER
This indicator is a technical analysis tool, not investment advice. The author is not a registered investment adviser, broker or dealer. Nothing here is a recommendation to buy, sell or hold any instrument. What you see on the chart is the output of a calculation you configured. Any decision you take from it is yours. Past behaviour of an indicator — including anything you observe in historical bars or in a backtest, which is a simulation — does not indicate future results. Trading carries a real risk of loss, including your entire capital. Charting uses TradingView® technology. TradingView is unaffiliated with the author. For educational purposes only. Not investment advice.
Undertow looks at who is moving price rather than where price is going. It keeps two volume readings apart: the crowd, read on the loud bars where volume expands, and the quiet money, read on the calm bars where volume contracts. The upside event is the bar on which the quiet side turns decisively up while the crowd is still on the selling side. The downside event is the mirror and is off by default. The core computation follows the Koncorde indicator on TradingView, credited to its author.
HOW IT WORKS
Bar by bar, the indicator builds two running price indices. One moves only on bars where volume rises compared with the bar before, which is the crowd. The other moves only on bars where volume falls, which is the quiet money. Each is compared with its own smoothed average and scaled to its recent range. The crowd reading is then added to a blended trend reading made from a momentum measure, a volume-weighted momentum measure, the position of price inside a wide band and a stochastic position. The upside event is registered when the quiet reading crosses above the average of the trend reading while it is already positive and the crowd reading is still negative. The downside event needs the quiet reading to cross below zero while the crowd is above both the trend reading and its average. Three filters thin the reports. The strength filter asks the quiet reading to be below the trend average on the downside. The candle filter asks the bar to close in the event's direction. The position guard keeps a side quiet after it has fired until the other side fires. A profile sets how much history is weighed. Where a chart carries no volume, the bar's own range is used instead.
An L marker on a 15m Bitcoin chart, on the bar where the quiet side of volume turns up while the crowd is still selling.
WHAT YOU'LL SEE ON THE CHART
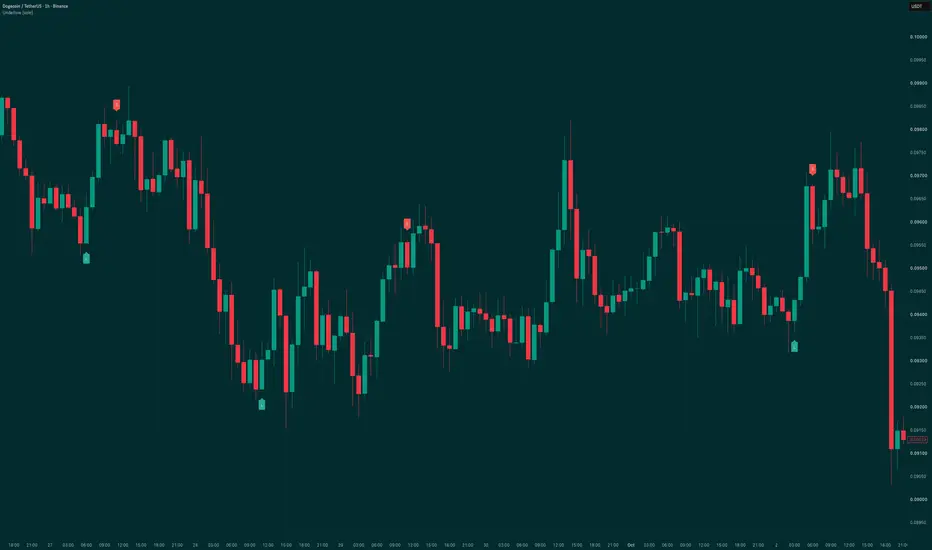
- Signal markers — a filled L label below the bar for the upside event, and a filled S label above the bar for the downside event when it is switched on. State-change markers, not instructions.
The same marker on a 15m Ethereum chart. Events are reported rarely, with long quiet stretches between markers.
BEST FOR
Markets: Crypto, US Stocks, Commodity.
Timeframes: Crypto 15m–1D; US Stocks 1h–1D; Commodity 1h.
ALERTS
- Quiet accumulation confirmed
- Quiet distribution confirmed
OPEN SOURCE
The source code is open and published under the Mozilla Public License 2.0, so it can be read, checked and reused under those terms.
CREDIT
The core computation follows Koncorde by Blai5, as published on TradingView by manboto. This script is a separate adaptation: it keeps the crowd and quiet-money readings apart and reports one event per state change.
ACCESS
Free, open-source script.
DISCLAIMER
This indicator is a technical analysis tool, not investment advice. The author is not a registered investment adviser, broker or dealer. Nothing here is a recommendation to buy, sell or hold any instrument. What you see on the chart is the output of a calculation you configured. Any decision you take from it is yours. Past behaviour of an indicator — including anything you observe in historical bars or in a backtest, which is a simulation — does not indicate future results. Trading carries a real risk of loss, including your entire capital. Charting uses TradingView® technology. TradingView is unaffiliated with the author. For educational purposes only. Not investment advice.
开源脚本
秉承TradingView的精神,该脚本的作者将其开源,以便交易者可以查看和验证其功能。向作者致敬!您可以免费使用该脚本,但请记住,重新发布代码须遵守我们的网站规则。

volebot — technical-analysis indicators with plain-language docs. Access requests and contact: vole.bot
免责声明
这些信息和出版物并非旨在提供,也不构成TradingView提供或认可的任何形式的财务、投资、交易或其他类型的建议或推荐。请阅读使用条款了解更多信息。
开源脚本
秉承TradingView的精神,该脚本的作者将其开源,以便交易者可以查看和验证其功能。向作者致敬!您可以免费使用该脚本,但请记住,重新发布代码须遵守我们的网站规则。
免责声明
这些信息和出版物并非旨在提供,也不构成TradingView提供或认可的任何形式的财务、投资、交易或其他类型的建议或推荐。请阅读使用条款了解更多信息。