已更新
The Islnd Tap and Fill
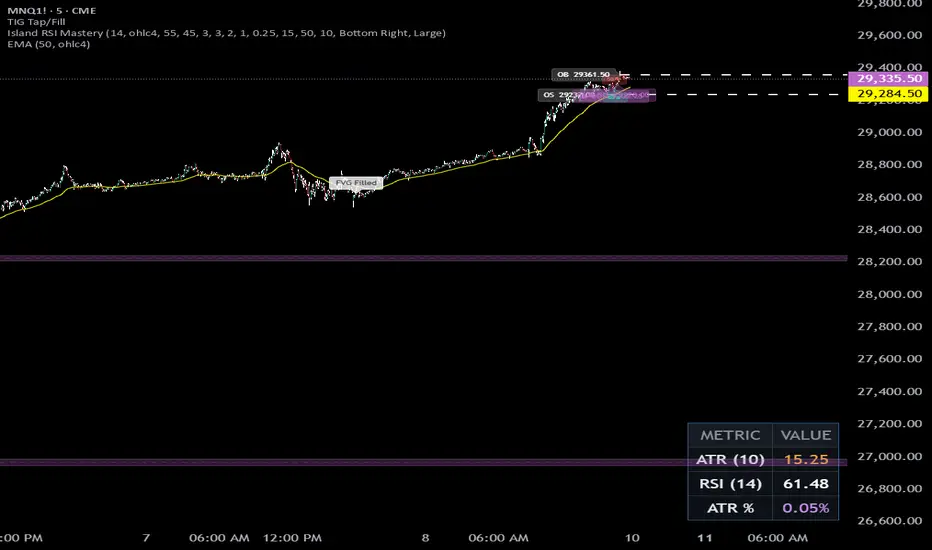
The Islnd Tap and Fill indicator automatically identifies and visualizes Bullish and Bearish Gaps using a three‑candle pattern.
It plots colored zones extended to the right, draws an optional midline with price labels, and tracks each gap’s lifecycle.
When price first trades back into a gap, the indicator marks a “Tap”; when price fully closes through the gap, it removes the zone and associated markings and prints an “FVG Filled” label.
This provides a clear, structured view of where price has left and later revisited imbalanced areas, supporting precise entry, management, and exit decisions.
It plots colored zones extended to the right, draws an optional midline with price labels, and tracks each gap’s lifecycle.
When price first trades back into a gap, the indicator marks a “Tap”; when price fully closes through the gap, it removes the zone and associated markings and prints an “FVG Filled” label.
This provides a clear, structured view of where price has left and later revisited imbalanced areas, supporting precise entry, management, and exit decisions.
版本注释
Improved v2.0
免责声明
这些信息和出版物并非旨在提供,也不构成TradingView提供或认可的任何形式的财务、投资、交易或其他类型的建议或推荐。请阅读使用条款了解更多信息。
免责声明
这些信息和出版物并非旨在提供,也不构成TradingView提供或认可的任何形式的财务、投资、交易或其他类型的建议或推荐。请阅读使用条款了解更多信息。