OPEN-SOURCE SCRIPT
Anchored VWAP (HTF)
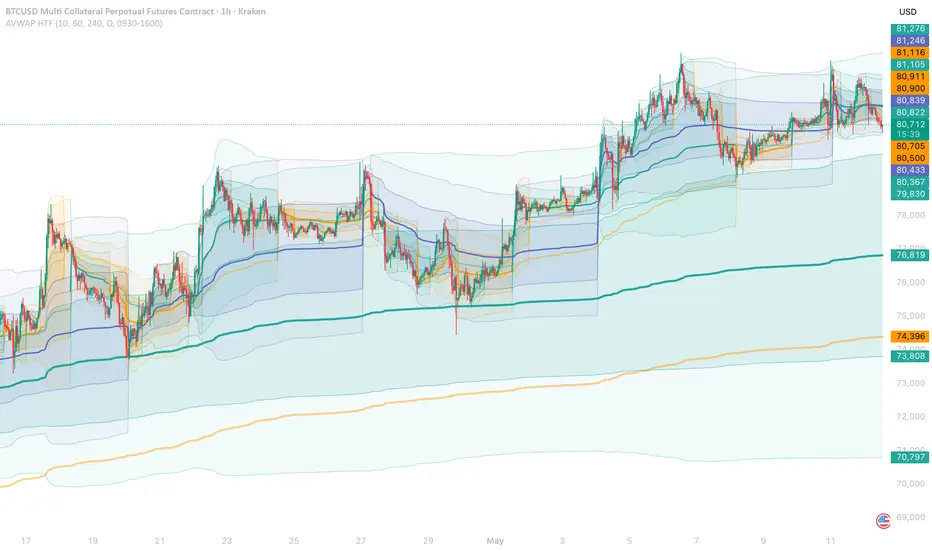
Anchored VWAP (HTF Structural)
Anchored VWAPs computed from confirmed swing pivots on up to three higher timeframes, rendered on the current chart at full resolution. Each timeframe shows two slots — an active AVWAP from the most recent pivot and a faded AVWAP from the prior one — so you can see how volume-weighted commitment evolved through the previous structural phase and how it's evolving now. True cumulative standard deviation bands (±1σ, ±2σ) wrap the active AVWAP, computed via König's formula for numerical stability over long accumulations.
The point is to surface where volume-weighted price sits across structural horizons, anchored to the same pivot events that other tools in this collection use as reference points.
How it works
For each of the three configured timeframes, the script runs swing-pivot detection inside request.security and emits a signal when a new bullish (pivot low) or bearish (pivot high) anchor is confirmed. The detection runs on the higher timeframe; the accumulation runs on the chart's own bars. This dual-resolution design means the AVWAP curves are smooth and scroll-stable rather than stepped, even though the anchors come from HTF structure.
When a new HTF pivot fires:
Accumulation uses three running sums per slot:
Pine Script®
with p = hlc3, v = effective volume per bar. The AVWAP is Σpv / Σv. The true cumulative standard deviation is computed via König's formula:
Pine Script®
A new active anchor is marked mitigated when price closes on the wrong side of the anchor pivot — below a swing-low anchor for a bull case, above a swing-high anchor for a bear case. Mitigated active AVWAPs turn grey but continue accumulating; the visual cue tells you the structural premise of that AVWAP has been challenged.
For instruments where TradingView reports no real volume (forex), the script transparently falls back to TWAP (time-weighted average price) by treating each bar's volume as 1. A small "TWAP (volume N/A)" label appears at the chart's right edge so you know what's being plotted.
How to read it
Each timeframe gets its own border weight (thin → medium → thick) so higher-TF AVWAPs visually dominate. Color carries direction:
Bands wrap the active AVWAP only:
When price is well outside the ±2σ band, it's trading meaningfully far from volume-weighted consensus formed since the anchor — typically a sign of either strong directional commitment (if the move is recent) or extension that may be due to revert.
Session VWAPs layer additional context:
When multiple AVWAPs cluster at the same price — a 1H bullish AVWAP, a 4H bullish AVWAP, and the Weekly VWAP all sitting in the same region — that's volume-weighted confluence and tends to act as a stronger reference than any single line.
Inputs
Notes
The dual-resolution design (HTF anchor detection, chart-resolution accumulation) is the indicator's most important architectural choice. Most MTF AVWAP implementations either run everything on the higher timeframe (producing stepped, low-resolution curves) or run everything on the chart timeframe with a longer pivot length (sacrificing the structural meaning of the anchor). This script does both correctly: pivots are detected with full higher-timeframe authority via request.security, but the volume accumulation that defines the AVWAP runs on every chart bar. The result is smooth curves readable on any chart timeframe.
The two-slot rotation per timeframe is unusual but practically useful. When a new pivot fires, you don't immediately lose the prior AVWAP — it stays visible (faded) until the next pivot fires after that. During the early bars of a new anchor (when its AVWAP and bands are still establishing), you can still see where the previous anchor's curve sat and judge continuity between them. Once a third pivot fires, the original anchor finally drops off.
The cumulative standard deviation is true cumulative, not rolling. Most VWAP-band indicators on TradingView use a rolling stdev over a fixed window, which doesn't actually reflect volume-weighted dispersion since the anchor — it just shows recent volatility. The König-formula approach here computes the actual variance of volume-weighted price across every bar since the anchor, which is what you'd want for structural AVWAP analysis.
Mitigation here means something different from the SMC indicators in this collection. For OB / FVG / Liquidity Areas, "mitigated" means price has interacted with the zone — usually expected behavior. For AVWAP, "mitigated" means price has closed on the wrong side of the anchor pivot, which is a meaningful failure of the structural premise. A bullish AVWAP anchored at a swing low loses its supportive interpretation once price closes below that low. The grey coloring marks this without removing the AVWAP from the chart, since it's still informative as historical reference.
The TWAP fallback for forex is a small but practical touch. TradingView's volume data for FX is fabricated tick-count data, not real volume, so a strict VWAP calculation would be misleading. Reverting to time-weighted (treating volume as 1) gives an honest, useful average that doesn't pretend to represent volume-weighted commitment. The right-edge label makes the substitution explicit so you're not silently looking at the wrong thing.
Higher-timeframe pivots don't confirm until pivot length bars after the actual swing. On Daily with length 10, that's ten days of delay between the swing and the new anchor appearing. AVWAPs are non-repainting from the moment the anchor confirms.
This is a structural tool, not a signal generator. It marks where volume-weighted commitment sits across multiple horizons.
Five years of work on a trading system left me with dozens of indicators that ultimately didn't earn a place in the final build. They're not failures — they're tools that solved problems I no longer needed solved. So instead of shelving them, I'm publishing the majority of them open-source.
If you're a discretionary trader, take what's useful. If you're a systems builder, the source is yours to dissect, modify, and improve. The best return on five years of work is for it to keep working — for someone.
If you use this script — or part of it — in your own work, please credit the original with a link back to my profile.
Note: these indicators have been updated to Pine Script v6 — some manually, some with AI assistance.
Anchored VWAPs computed from confirmed swing pivots on up to three higher timeframes, rendered on the current chart at full resolution. Each timeframe shows two slots — an active AVWAP from the most recent pivot and a faded AVWAP from the prior one — so you can see how volume-weighted commitment evolved through the previous structural phase and how it's evolving now. True cumulative standard deviation bands (±1σ, ±2σ) wrap the active AVWAP, computed via König's formula for numerical stability over long accumulations.
The point is to surface where volume-weighted price sits across structural horizons, anchored to the same pivot events that other tools in this collection use as reference points.
How it works
For each of the three configured timeframes, the script runs swing-pivot detection inside request.security and emits a signal when a new bullish (pivot low) or bearish (pivot high) anchor is confirmed. The detection runs on the higher timeframe; the accumulation runs on the chart's own bars. This dual-resolution design means the AVWAP curves are smooth and scroll-stable rather than stepped, even though the anchors come from HTF structure.
When a new HTF pivot fires:
- The current active slot's accumulators (Σpv, Σv, Σp²v) are demoted to the faded historical slot, preserving the prior anchor's curve for visual context.
- A fresh active slot opens at the new pivot's bar.
Accumulation uses three running sums per slot:
with p = hlc3, v = effective volume per bar. The AVWAP is Σpv / Σv. The true cumulative standard deviation is computed via König's formula:
A new active anchor is marked mitigated when price closes on the wrong side of the anchor pivot — below a swing-low anchor for a bull case, above a swing-high anchor for a bear case. Mitigated active AVWAPs turn grey but continue accumulating; the visual cue tells you the structural premise of that AVWAP has been challenged.
For instruments where TradingView reports no real volume (forex), the script transparently falls back to TWAP (time-weighted average price) by treating each bar's volume as 1. A small "TWAP (volume N/A)" label appears at the chart's right edge so you know what's being plotted.
How to read it
Each timeframe gets its own border weight (thin → medium → thick) so higher-TF AVWAPs visually dominate. Color carries direction:
- Bullish anchor (default teal) — anchored to a swing low; treat as dynamic support
- Bearish anchor (default amber) — anchored to a swing high; treat as dynamic resistance
- Mitigated (grey) — active AVWAP whose anchor pivot has been violated
- Historical (faded, same hue) — the previous anchor's AVWAP, kept for context
Bands wrap the active AVWAP only:
- ±1σ — the central 68% of volume-weighted price activity since the anchor
- ±2σ — the central 95%
When price is well outside the ±2σ band, it's trading meaningfully far from volume-weighted consensus formed since the anchor — typically a sign of either strong directional commitment (if the move is recent) or extension that may be due to revert.
Session VWAPs layer additional context:
- Weekly VWAP (default indigo) with ±1σ / ±2σ bands — the calendar week's volume-weighted price
- NY Session VWAP (default magenta) with ±1σ band — useful on intraday charts during US trading hours
When multiple AVWAPs cluster at the same price — a 1H bullish AVWAP, a 4H bullish AVWAP, and the Weekly VWAP all sitting in the same region — that's volume-weighted confluence and tends to act as a stronger reference than any single line.
Inputs
- HTF Pivot Length — bars required on each side to confirm a swing. Default 10.
- Timeframes 1/2/3 — defaults: 1H, 4H, Daily. TF1 and TF2 on; TF3 off by default.
- ±1σ Band — show one-sigma bands on each active AVWAP. Default on.
- ±2σ Band — show two-sigma bands. Default on.
- Weekly VWAP — show the calendar-week VWAP with its bands. Default on.
- NY Session VWAP — show the New York session VWAP with its bands. Default off (only meaningful on intraday charts).
- NY Session Hours — session string in exchange timezone. Default 0930-1600.
- Colors — bullish anchor, bearish anchor, weekly VWAP, NY session VWAP.
Notes
The dual-resolution design (HTF anchor detection, chart-resolution accumulation) is the indicator's most important architectural choice. Most MTF AVWAP implementations either run everything on the higher timeframe (producing stepped, low-resolution curves) or run everything on the chart timeframe with a longer pivot length (sacrificing the structural meaning of the anchor). This script does both correctly: pivots are detected with full higher-timeframe authority via request.security, but the volume accumulation that defines the AVWAP runs on every chart bar. The result is smooth curves readable on any chart timeframe.
The two-slot rotation per timeframe is unusual but practically useful. When a new pivot fires, you don't immediately lose the prior AVWAP — it stays visible (faded) until the next pivot fires after that. During the early bars of a new anchor (when its AVWAP and bands are still establishing), you can still see where the previous anchor's curve sat and judge continuity between them. Once a third pivot fires, the original anchor finally drops off.
The cumulative standard deviation is true cumulative, not rolling. Most VWAP-band indicators on TradingView use a rolling stdev over a fixed window, which doesn't actually reflect volume-weighted dispersion since the anchor — it just shows recent volatility. The König-formula approach here computes the actual variance of volume-weighted price across every bar since the anchor, which is what you'd want for structural AVWAP analysis.
Mitigation here means something different from the SMC indicators in this collection. For OB / FVG / Liquidity Areas, "mitigated" means price has interacted with the zone — usually expected behavior. For AVWAP, "mitigated" means price has closed on the wrong side of the anchor pivot, which is a meaningful failure of the structural premise. A bullish AVWAP anchored at a swing low loses its supportive interpretation once price closes below that low. The grey coloring marks this without removing the AVWAP from the chart, since it's still informative as historical reference.
The TWAP fallback for forex is a small but practical touch. TradingView's volume data for FX is fabricated tick-count data, not real volume, so a strict VWAP calculation would be misleading. Reverting to time-weighted (treating volume as 1) gives an honest, useful average that doesn't pretend to represent volume-weighted commitment. The right-edge label makes the substitution explicit so you're not silently looking at the wrong thing.
Higher-timeframe pivots don't confirm until pivot length bars after the actual swing. On Daily with length 10, that's ten days of delay between the swing and the new anchor appearing. AVWAPs are non-repainting from the moment the anchor confirms.
This is a structural tool, not a signal generator. It marks where volume-weighted commitment sits across multiple horizons.
Five years of work on a trading system left me with dozens of indicators that ultimately didn't earn a place in the final build. They're not failures — they're tools that solved problems I no longer needed solved. So instead of shelving them, I'm publishing the majority of them open-source.
If you're a discretionary trader, take what's useful. If you're a systems builder, the source is yours to dissect, modify, and improve. The best return on five years of work is for it to keep working — for someone.
If you use this script — or part of it — in your own work, please credit the original with a link back to my profile.
Note: these indicators have been updated to Pine Script v6 — some manually, some with AI assistance.
开源脚本
秉承TradingView的精神,该脚本的作者将其开源,以便交易者可以查看和验证其功能。向作者致敬!您可以免费使用该脚本,但请记住,重新发布代码须遵守我们的网站规则。

免责声明
这些信息和出版物并非旨在提供,也不构成TradingView提供或认可的任何形式的财务、投资、交易或其他类型的建议或推荐。请阅读使用条款了解更多信息。
开源脚本
秉承TradingView的精神,该脚本的作者将其开源,以便交易者可以查看和验证其功能。向作者致敬!您可以免费使用该脚本,但请记住,重新发布代码须遵守我们的网站规则。
免责声明
这些信息和出版物并非旨在提供,也不构成TradingView提供或认可的任何形式的财务、投资、交易或其他类型的建议或推荐。请阅读使用条款了解更多信息。