OPEN-SOURCE SCRIPT
Harmonic Liquidity Waves [JOAT]
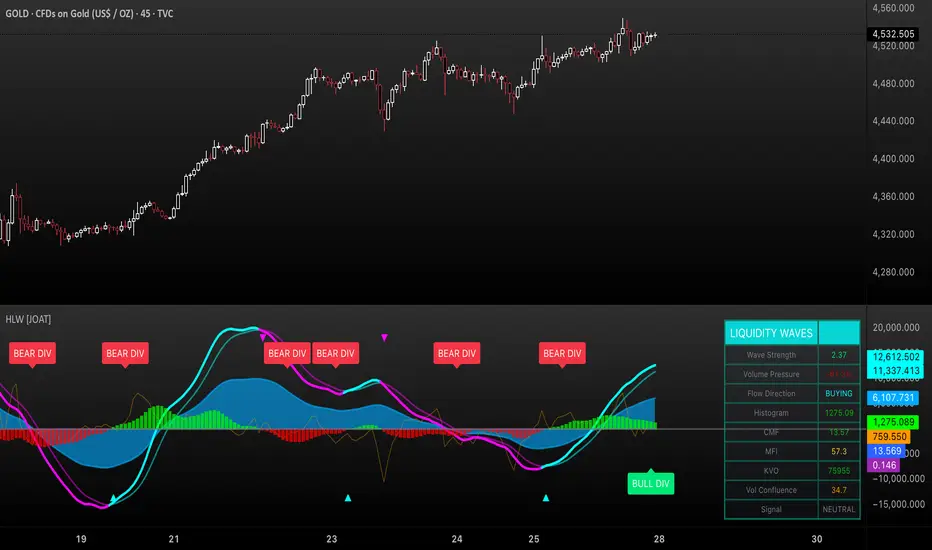
Harmonic Liquidity Waves [JOAT]
Overview
Harmonic Liquidity Waves is an open-source oscillator indicator that combines multiple volume-based analysis techniques into a unified liquidity flow framework. It integrates VWAP calculations, Chaikin Money Flow (CMF), Money Flow Index (MFI), and Klinger Volume Oscillator (KVO) with custom harmonic wave calculations to provide a comprehensive view of volume dynamics and money flow.
What This Indicator Does
The indicator calculates and displays:
How It Works
The core liquidity flow calculation tracks volume-weighted price changes:
Pine Script®
The harmonic oscillator applies multi-depth smoothing:
Pine Script®
CMF measures accumulation/distribution using the Money Flow Multiplier:
Pine Script®
Signal Generation
Liquidity shift signals occur when:
Strong signals require volume indicator confirmation:

Divergence detection compares price pivots with liquidity wave pivots to identify potential reversals.
Dashboard Panel (Bottom-Right)
Visual Elements
Input Parameters
Suggested Use Cases
Timeframe Recommendations
Best on 15m to Daily charts. Volume-based indicators require sufficient trading activity for meaningful readings.
Limitations
Open-Source and Disclaimer
This script is published as open-source under the Mozilla Public License 2.0 for educational purposes. It does not constitute financial advice. Past performance does not guarantee future results. Always use proper risk management.
- Made with passion by officialjackofalltrades
Overview
Harmonic Liquidity Waves is an open-source oscillator indicator that combines multiple volume-based analysis techniques into a unified liquidity flow framework. It integrates VWAP calculations, Chaikin Money Flow (CMF), Money Flow Index (MFI), and Klinger Volume Oscillator (KVO) with custom harmonic wave calculations to provide a comprehensive view of volume dynamics and money flow.
What This Indicator Does
The indicator calculates and displays:
- Liquidity Flow - Volume-weighted price movement accumulated over a lookback period
- Harmonic Wave - Multi-depth smoothed oscillator derived from liquidity flow
- Chaikin Money Flow (CMF) - Classic accumulation/distribution indicator
- Money Flow Index (MFI) - Volume-weighted RSI showing buying/selling pressure
- Klinger Volume Oscillator (KVO) - Trend-volume relationship indicator
- Wave Interference - Combined constructive/destructive wave patterns
- Volume Profile POC - Point of Control from simplified volume distribution
How It Works
The core liquidity flow calculation tracks volume-weighted price changes:
The harmonic oscillator applies multi-depth smoothing:
CMF measures accumulation/distribution using the Money Flow Multiplier:
Signal Generation
Liquidity shift signals occur when:
- Bullish Shift: Smoothed wave crosses above signal line
- Bearish Shift: Smoothed wave crosses below signal line
Strong signals require volume indicator confirmation:
- Strong Bull: Bullish shift + CMF > 0 + MFI > 50 + KVO > 0
- Strong Bear: Bearish shift + CMF < 0 + MFI < 50 + KVO < 0
Divergence detection compares price pivots with liquidity wave pivots to identify potential reversals.
Dashboard Panel (Bottom-Right)
- Wave Strength - Normalized wave magnitude
- Volume Pressure - Current volume vs average percentage
- Flow Direction - BUYING or SELLING based on wave sign
- Histogram - Wave minus signal line value
- CMF - Chaikin Money Flow reading
- MFI - Money Flow Index value (0-100)
- KVO - Klinger oscillator value
- Vol Confluence - Combined volume indicator score
- Signal - Current actionable status
Visual Elements
- Liquidity Wave - Main oscillator line
- Wave Signal - Smoothed signal line for crossover detection
- Wave Histogram - Difference between wave and signal
- Wave Interference - Area plot showing combined wave patterns
- CMF/KVO/MFI Lines - Individual volume indicator plots
- Divergence Labels - BULL DIV / BEAR DIV markers
- Shift Markers - Triangles for basic shifts, labels for strong shifts
Input Parameters
- Wave Period (default: 21) - Base period for liquidity calculations
- Volume Weight (default: 1.5) - Multiplier for volume emphasis
- Harmonic Depth (default: 3) - Number of smoothing layers
- Smoothing (default: 3) - Final wave smoothing period
Suggested Use Cases
- Identify accumulation/distribution phases using CMF and wave direction
- Confirm momentum with MFI overbought/oversold readings
- Watch for divergences between price and liquidity flow
- Use strong signals when multiple volume indicators align
Timeframe Recommendations
Best on 15m to Daily charts. Volume-based indicators require sufficient trading activity for meaningful readings.
Limitations
- Volume data quality varies by exchange and instrument
- Divergence detection uses pivot-based lookback and may lag
- Volume Profile POC is simplified and not a full profile analysis
Open-Source and Disclaimer
This script is published as open-source under the Mozilla Public License 2.0 for educational purposes. It does not constitute financial advice. Past performance does not guarantee future results. Always use proper risk management.
- Made with passion by officialjackofalltrades
开源脚本
秉承TradingView的精神,该脚本的作者将其开源,以便交易者可以查看和验证其功能。向作者致敬!您可以免费使用该脚本,但请记住,重新发布代码须遵守我们的网站规则。

The AI Trading Ecosystem, Built to win trades 📈
Get Full Access 👇
jackofalltrades.vip 🌐
t.me/jackofalltradesvip 🃏
Get Full Access 👇
jackofalltrades.vip 🌐
t.me/jackofalltradesvip 🃏
免责声明
这些信息和出版物并非旨在提供,也不构成TradingView提供或认可的任何形式的财务、投资、交易或其他类型的建议或推荐。请阅读使用条款了解更多信息。
开源脚本
秉承TradingView的精神,该脚本的作者将其开源,以便交易者可以查看和验证其功能。向作者致敬!您可以免费使用该脚本,但请记住,重新发布代码须遵守我们的网站规则。
The AI Trading Ecosystem, Built to win trades 📈
Get Full Access 👇
jackofalltrades.vip 🌐
t.me/jackofalltradesvip 🃏
Get Full Access 👇
jackofalltrades.vip 🌐
t.me/jackofalltradesvip 🃏
免责声明
这些信息和出版物并非旨在提供,也不构成TradingView提供或认可的任何形式的财务、投资、交易或其他类型的建议或推荐。请阅读使用条款了解更多信息。