Auto Multi-TF Touchpoint Levels
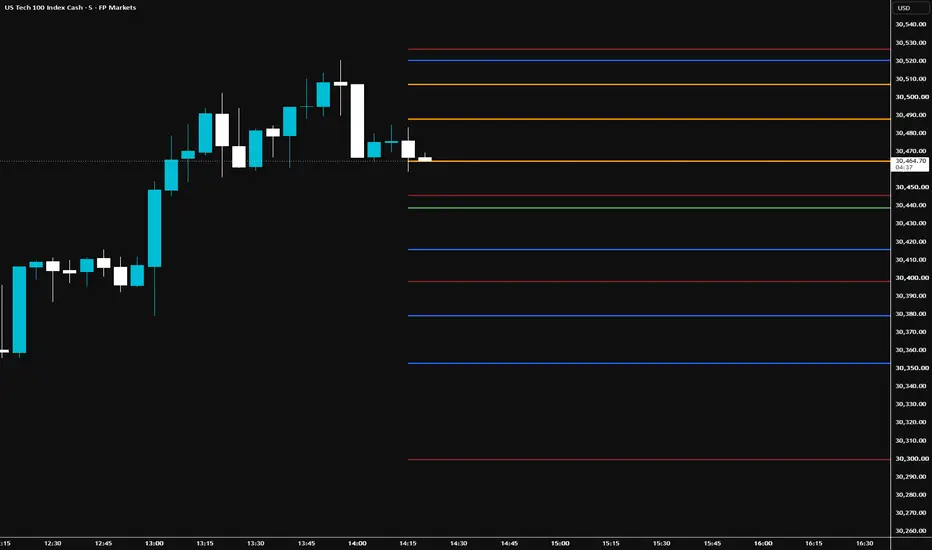
Auto Multi-TF Touchpoint & S/R Levels is a robust, highly customizable indicator designed to automatically plot key support and resistance levels across multiple timeframes directly onto your active chart.
Inspired by structural price action and touchpoint analysis, this script eliminates the manual labor of drawing horizontal lines by automatically calculating the previous period's highs and lows for various timeframes—capturing the exact zones where price frequently reacts and consolidates.
Key Features
Multi-Timeframe Support: Seamlessly toggle and track levels from intraday to macro timeframes, including 5m, 10m, 15m, 30m, 1h, 4h, Daily (1D), and Weekly (1W).
Granular Customization: Full control over your visual workspace. Tailor each timeframe's aesthetic independently with user-defined options for:
Color Pickers (with adjustable opacity/transparency)
Line Styles (Solid, Dashed, or Dotted)
Line Thickness / Width (1 to 5)
Clean Chart Management: Dynamically updates and extends lines right to the edge of the chart (extend.right), keeping your workspace organized without cluttering past candles.
How to Use
Add the indicator to any chart (optimized for indices, forex, and crypto).
Open the Settings menu to enable/disable the specific timeframes you trade.
Use the Visuals & Colors and Line Styles & Thickness tabs to color-code your levels (e.g., distinct colors for intraday vs. macro weekly zones) to align with your personal trading strategy.
Tip: Perfect for day traders and swing traders looking to automate structural reference points on indices like the Nasdaq/US100 or other popular instruments.
Inspired by structural price action and touchpoint analysis, this script eliminates the manual labor of drawing horizontal lines by automatically calculating the previous period's highs and lows for various timeframes—capturing the exact zones where price frequently reacts and consolidates.
Key Features
Multi-Timeframe Support: Seamlessly toggle and track levels from intraday to macro timeframes, including 5m, 10m, 15m, 30m, 1h, 4h, Daily (1D), and Weekly (1W).
Granular Customization: Full control over your visual workspace. Tailor each timeframe's aesthetic independently with user-defined options for:
Color Pickers (with adjustable opacity/transparency)
Line Styles (Solid, Dashed, or Dotted)
Line Thickness / Width (1 to 5)
Clean Chart Management: Dynamically updates and extends lines right to the edge of the chart (extend.right), keeping your workspace organized without cluttering past candles.
How to Use
Add the indicator to any chart (optimized for indices, forex, and crypto).
Open the Settings menu to enable/disable the specific timeframes you trade.
Use the Visuals & Colors and Line Styles & Thickness tabs to color-code your levels (e.g., distinct colors for intraday vs. macro weekly zones) to align with your personal trading strategy.
Tip: Perfect for day traders and swing traders looking to automate structural reference points on indices like the Nasdaq/US100 or other popular instruments.

免责声明
这些信息和出版物并非旨在提供,也不构成TradingView提供或认可的任何形式的财务、投资、交易或其他类型的建议或推荐。请阅读使用条款了解更多信息。