已更新
HTF Candle Box [rare_gold_steak]
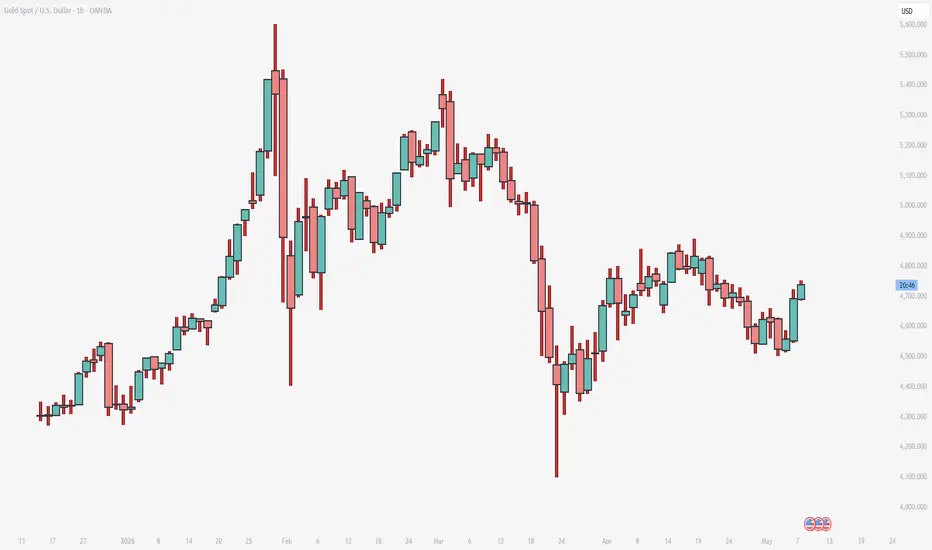
See the bigger picture
This indicator will overlay higher timeframe candles directly on your chart, so you can see the structure far more clearly. Whether you're on 1H showing 1D candles, or on 1D showing Weekly candles, it will make price easier to read at a glance
Plots the box as a normal candle would:
Everything is customizable. Enjoy
This indicator will overlay higher timeframe candles directly on your chart, so you can see the structure far more clearly. Whether you're on 1H showing 1D candles, or on 1D showing Weekly candles, it will make price easier to read at a glance
Plots the box as a normal candle would:
- Open — where price started the day
- Close — where price ended the day
- High — highest point reached
- Low — lowest point reached
Everything is customizable. Enjoy
版本注释
Updated to show GREEN/RED candles on default. Can be turned off in the settings.
免责声明
这些信息和出版物并非旨在提供,也不构成TradingView提供或认可的任何形式的财务、投资、交易或其他类型的建议或推荐。请阅读使用条款了解更多信息。
免责声明
这些信息和出版物并非旨在提供,也不构成TradingView提供或认可的任何形式的财务、投资、交易或其他类型的建议或推荐。请阅读使用条款了解更多信息。