OPEN-SOURCE SCRIPT
已更新 Imtiyaz Signature Liquidity Compass SMC
Imtiyaz Signature Liquidity Compass SMC
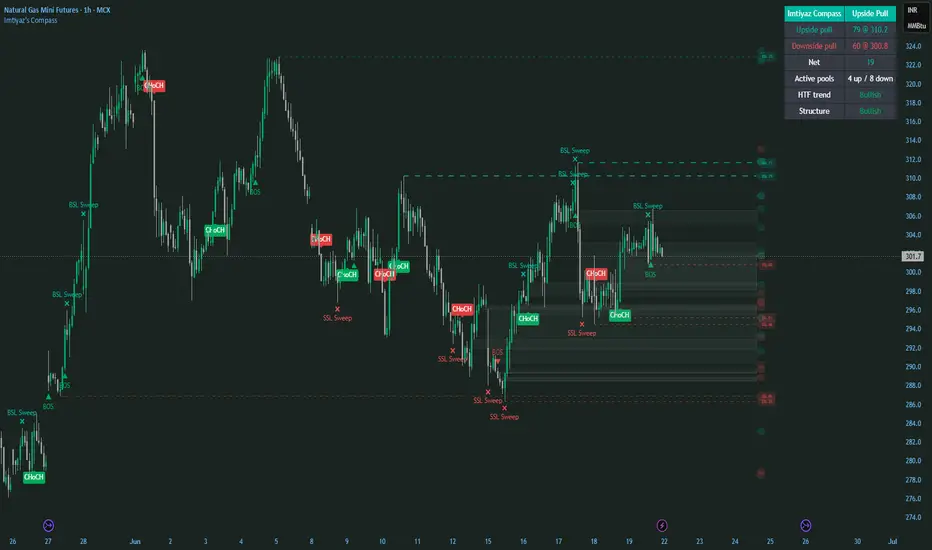
Imtiyaz Signature Liquidity Compass SMC is an original Smart Money Concepts decision-support indicator that maps nearby buy-side and sell-side liquidity, tracks sweeps, highlights structure breaks, displays fair value gaps, and ranks the strongest active liquidity target on each side of price.
The purpose of the tool is not to predict the future or issue guaranteed buy/sell calls. It is designed to help traders see where meaningful liquidity may be resting, whether one side of the market has stronger current pull, and how that context lines up with structure and higher-timeframe trend.
What It Shows
Scoring Model
Every active liquidity pool receives a 0-100 score. The score is a weighted context reading, not a probability.
The score combines:
The dashboard compares the strongest upside pool against the strongest downside pool. If the difference is small, the field is marked Balanced. If one side is stronger by the selected threshold, the dashboard marks Upside Pull or Downside Pull.
Main Settings
Swing Confirmation Length controls how important a swing must be before it becomes a liquidity pool. A higher value creates fewer but more significant levels.
Maximum Pools Per Side limits how many active buy-side and sell-side pools are kept on the chart.
Pool Freshness Window controls how quickly old pools lose score.
Touch Buffer ATR controls how close price must get before a pool is considered touched.
Sweep Confirmation lets you choose between wick-only sweep detection and stricter close-back-inside sweep detection.
Minimum Visible Pool Score hides weaker pools so the chart remains clean.
Dominance Threshold controls how much stronger one side must be before the dashboard changes from Balanced to a directional pull.
HTF Trend Timeframe and HTF EMA Length define the higher-timeframe trend component used in the scoring engine.
Alerts
The indicator includes alerts for:
How To Use
Start with the dashboard. If the field is Balanced, liquidity pressure is mixed and traders may prefer to wait for a sweep, structure break, or FVG reaction. If Upside Pull or Downside Pull is dominant, look at the strongest marked pool and judge whether price action supports a move toward or away from that area.
Liquidity sweeps can be used as context for potential reversals or displacement. BOS and CHOCH markers help separate continuation from possible directional change. FVGs highlight imbalance areas that may later be revisited or mitigated.
This indicator is best used alongside a complete trading plan, risk management, and independent confirmation. It does not guarantee future price movement, win rate, profitability, or signal accuracy.
Originality
Imtiyaz Signature Liquidity Compass SMC uses an original scoring model that combines liquidity-pool distance, swing volume, freshness, reaction count, side validity, and higher-timeframe trend alignment. The goal is to reduce chart clutter by showing the pools that currently matter most, while keeping the logic transparent and avoiding unsupported probability claims.
Disclaimer
This script is for educational and informational purposes only. Trading involves risk. Always do your own analysis before taking any trade.
Imtiyaz Signature Liquidity Compass SMC is an original Smart Money Concepts decision-support indicator that maps nearby buy-side and sell-side liquidity, tracks sweeps, highlights structure breaks, displays fair value gaps, and ranks the strongest active liquidity target on each side of price.
The purpose of the tool is not to predict the future or issue guaranteed buy/sell calls. It is designed to help traders see where meaningful liquidity may be resting, whether one side of the market has stronger current pull, and how that context lines up with structure and higher-timeframe trend.
What It Shows
- Buy-side liquidity pools above price, based on confirmed swing highs.
- Sell-side liquidity pools below price, based on confirmed swing lows.
- Buy-side and sell-side liquidity sweeps.
- Bullish and bearish BOS events.
- Bullish and bearish CHOCH events when structure changes direction.
- Bullish and bearish Fair Value Gaps.
- A compact dashboard showing upside pull, downside pull, net pull, active pool counts, HTF trend, and current structure.
Scoring Model
Every active liquidity pool receives a 0-100 score. The score is a weighted context reading, not a probability.
The score combines:
- Distance from current price, normalized by ATR.
- Volume at the swing that created the pool.
- Freshness of the pool.
- Number of touches or reactions.
- Whether the pool is still on the correct side of price.
- Higher-timeframe EMA trend alignment.
The dashboard compares the strongest upside pool against the strongest downside pool. If the difference is small, the field is marked Balanced. If one side is stronger by the selected threshold, the dashboard marks Upside Pull or Downside Pull.
Main Settings
Swing Confirmation Length controls how important a swing must be before it becomes a liquidity pool. A higher value creates fewer but more significant levels.
Maximum Pools Per Side limits how many active buy-side and sell-side pools are kept on the chart.
Pool Freshness Window controls how quickly old pools lose score.
Touch Buffer ATR controls how close price must get before a pool is considered touched.
Sweep Confirmation lets you choose between wick-only sweep detection and stricter close-back-inside sweep detection.
Minimum Visible Pool Score hides weaker pools so the chart remains clean.
Dominance Threshold controls how much stronger one side must be before the dashboard changes from Balanced to a directional pull.
HTF Trend Timeframe and HTF EMA Length define the higher-timeframe trend component used in the scoring engine.
Alerts
The indicator includes alerts for:
- Buy-side liquidity sweep.
- Sell-side liquidity sweep.
- Bullish BOS or CHOCH.
- Bearish BOS or CHOCH.
- Upside liquidity pull becoming dominant.
- Downside liquidity pull becoming dominant.
- Bullish FVG formation.
- Bearish FVG formation.
How To Use
Start with the dashboard. If the field is Balanced, liquidity pressure is mixed and traders may prefer to wait for a sweep, structure break, or FVG reaction. If Upside Pull or Downside Pull is dominant, look at the strongest marked pool and judge whether price action supports a move toward or away from that area.
Liquidity sweeps can be used as context for potential reversals or displacement. BOS and CHOCH markers help separate continuation from possible directional change. FVGs highlight imbalance areas that may later be revisited or mitigated.
This indicator is best used alongside a complete trading plan, risk management, and independent confirmation. It does not guarantee future price movement, win rate, profitability, or signal accuracy.
Originality
Imtiyaz Signature Liquidity Compass SMC uses an original scoring model that combines liquidity-pool distance, swing volume, freshness, reaction count, side validity, and higher-timeframe trend alignment. The goal is to reduce chart clutter by showing the pools that currently matter most, while keeping the logic transparent and avoiding unsupported probability claims.
Disclaimer
This script is for educational and informational purposes only. Trading involves risk. Always do your own analysis before taking any trade.
版本注释
UPDATES开源脚本
秉承TradingView的精神,该脚本的作者将其开源,以便交易者可以查看和验证其功能。向作者致敬!您可以免费使用该脚本,但请记住,重新发布代码须遵守我们的网站规则。

免责声明
这些信息和出版物并非旨在提供,也不构成TradingView提供或认可的任何形式的财务、投资、交易或其他类型的建议或推荐。请阅读使用条款了解更多信息。
开源脚本
秉承TradingView的精神,该脚本的作者将其开源,以便交易者可以查看和验证其功能。向作者致敬!您可以免费使用该脚本,但请记住,重新发布代码须遵守我们的网站规则。
免责声明
这些信息和出版物并非旨在提供,也不构成TradingView提供或认可的任何形式的财务、投资、交易或其他类型的建议或推荐。请阅读使用条款了解更多信息。