tavanios BTC SMA20 Deviation Levels
by tavanios BTC Monthly SMA20 Deviation Levels
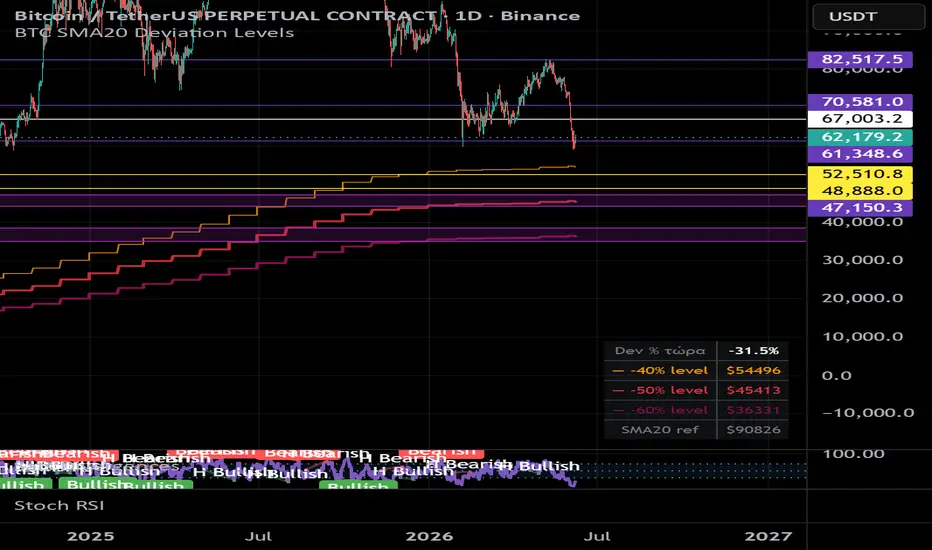
This indicator tracks Bitcoin's deviation from its 20-month Simple Moving Average (SMA20) and plots key historical accumulation zones based on previous bear market drawdowns.
The script automatically calculates the monthly SMA20 and displays three major deviation levels:
• -40% below SMA20
• -50% below SMA20
• -60% below SMA20
These levels have historically acted as areas where Bitcoin approached long-term cycle bottoms during deep market corrections.
Features:
Automatic calculation of Bitcoin's 20-month SMA.
Visual plotting of -40%, -50%, and -60% deviation levels.
Background color zones highlighting periods of extreme undervaluation.
Real-time table displaying the current deviation percentage, SMA20 value, and corresponding accumulation levels.
Designed for long-term investors and cycle analysis.
This indicator is intended for educational and market analysis purposes only and should not be considered financial advice.
This indicator tracks Bitcoin's deviation from its 20-month Simple Moving Average (SMA20) and plots key historical accumulation zones based on previous bear market drawdowns.
The script automatically calculates the monthly SMA20 and displays three major deviation levels:
• -40% below SMA20
• -50% below SMA20
• -60% below SMA20
These levels have historically acted as areas where Bitcoin approached long-term cycle bottoms during deep market corrections.
Features:
Automatic calculation of Bitcoin's 20-month SMA.
Visual plotting of -40%, -50%, and -60% deviation levels.
Background color zones highlighting periods of extreme undervaluation.
Real-time table displaying the current deviation percentage, SMA20 value, and corresponding accumulation levels.
Designed for long-term investors and cycle analysis.
This indicator is intended for educational and market analysis purposes only and should not be considered financial advice.

免责声明
这些信息和出版物并非旨在提供,也不构成TradingView提供或认可的任何形式的财务、投资、交易或其他类型的建议或推荐。请阅读使用条款了解更多信息。
免责声明
这些信息和出版物并非旨在提供,也不构成TradingView提供或认可的任何形式的财务、投资、交易或其他类型的建议或推荐。请阅读使用条款了解更多信息。