已更新
Squeeze Verdict Lab: Squeeze Momentum Test [forexobroker]
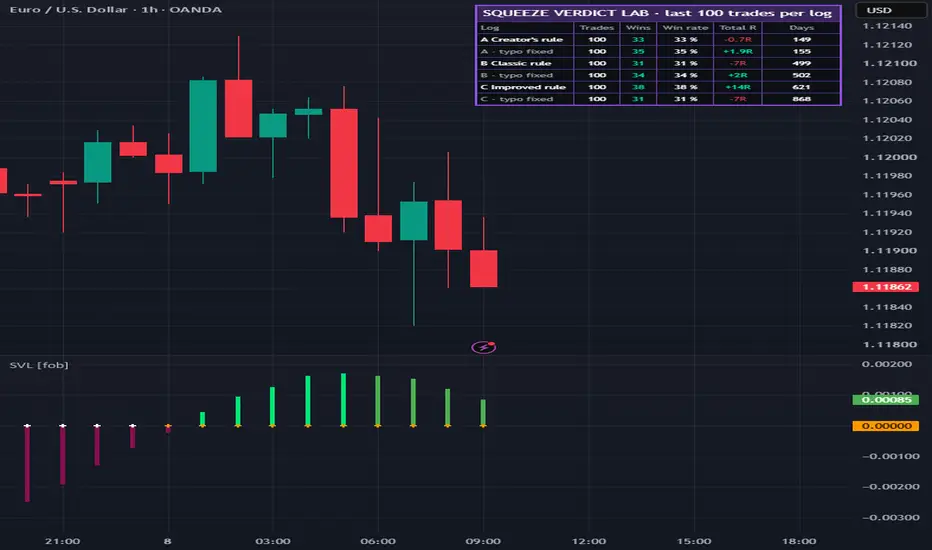
Squeeze Verdict Lab: Squeeze Momentum Test [forexobroker]
🔶 OVERVIEW
Squeeze Verdict Lab puts the Squeeze Momentum Indicator by LazyBear on trial on your own chart. It draws LazyBear's indicator with the same inputs and formulas, trades the three ways traders use it side by side, and logs every trade of each rule twice: once on the code as TradingView shows it, and once with the typo LazyBear flagged in 2014 fixed. One table shows all six logs over the last N trades, so you can see which rule, on which code, holds up on your market and timeframe.
Credit: the indicator part is the open-source "Squeeze Momentum Indicator [LazyBear]" (after John Carter's TTM Squeeze), reproduced with the same inputs and formulas. The rule logs, the two-code comparison, the stops and the table are the original work described below.
🔶 THE INDICATOR AND THE TYPO
- Squeeze ON (black cross on the zero line): the Bollinger Bands (20) are inside the Keltner Channel (20, 1.5 × true range). The market is coiling.
- Squeeze released (grey cross): the bands are back outside the channel. Neither: blue cross. (On a dark chart the script draws these two orange and white by default; see Cross colours.)
- The histogram is the momentum: a linear regression (20) of the close minus the average of the 20-candle midrange and the 20 SMA. Bright green: above zero and rising. Dark green: above zero and falling. Bright red: below zero and falling. Dark red: below zero and rising.
- The typo: the code TradingView shows builds the Bollinger width with the KC multiplier (1.5) instead of the BB multiplier, so the "BB MultFactor" input does nothing. LazyBear's note of 29 Sep 2014 says to use the updated source instead. This script computes the squeeze both ways: AS SHOWN (1.5) and FIXED (the BB MultFactor, 2.0 by default). The narrower bands of the typo put the market "in a squeeze" far more often.
🔶 THE THREE RULES
A. The creator's rule: the first grey cross after a black cross, in the direction of the momentum (histogram above zero = long, below = short). Exit at the close of the first candle whose histogram colour differs from the entry candle's.
B. The classic rule: the first grey cross after a black cross on a bright bar (bright green = long, bright red = short). Target 2R.
C. The improved rule: rule B, plus at least 6 black crosses in a row before the grey one, and the close above the 200 SMA for a long, below it for a short. Target 2R.
Every rule's stop sits at the 10-candle swing (the lowest low for a long, the highest high for a short, the signal candle included) and is never closer than 0.5 × ATR(14). That distance is 1R. One trade at a time per log. Every entry, stop and exit is evaluated on closed candles; when one candle touches both the stop and the target, the stop counts first.
NON-REPAINTING: everything is evaluated on barstate.isconfirmed; there is no request.security and no lookahead.
🔶 THE TABLE
Six rows (A, B and C, each as shown and fixed) over the last N trades of each log (100 by default): trades, wins, win rate, total R and the number of days the log covers. The log you choose is also drawn on the price chart: entry, stop, target and the result of every trade.
🔶 SETTINGS
Squeeze Momentum (LazyBear)
- BB length (20), BB MultFactor (2.0, used by the FIXED code only), KC length (20), KC MultFactor (1.5), use true range (on).
- Crosses drawn in the pane: as TradingView shows it, or the fixed code.
Rules
- Rule C: black crosses in a row before the grey one (6), trend SMA length (200).
- Which log is drawn on the chart; take longs, take shorts.
Stop and target
- Swing lookback (10), minimum stop distance (0.5 × ATR 14), target for rules B and C (2R), how far open trade boxes extend.
Log
- Log size (the last 100 trades per log), table on or off, position and text size.
Visual
- Cross colours: Auto (default), LazyBear (black / grey) or High contrast (orange / white). Auto reads the chart background: on a dark chart the squeeze-on crosses are drawn orange and the released ones white, because black crosses cannot be seen there; on a light chart they stay black and grey as in LazyBear's script.
- Histogram colours, trade colours, trades kept on the chart, box transparency.
🔶 ALERTS
Two alertcondition hooks (long entry, short entry) for the drawn log. With JSON alerts on, every entry and exit of the drawn log also fires an alert() once per bar close with a JSON body (action, log, ticker, timeframe, entry, stop or result).
🔶 LIMITATIONS
- Results depend on the market, the timeframe, the code version and the settings; the table shows them on your own chart, losses included.
- The table counts the script's own rules on closed candles: no spread, no commission, no slippage, and the stop is counted before the target on a candle that touches both.
- The last-N window covers different calendar spans on different timeframes (two weeks of 5-minute candles can hold as many trades as two years of 1-hour candles).
- This is an analysis tool, not financial advice, and past performance does not guarantee future results. Test on your own market and timeframe before relying on any signal.
🔶 RELEASE NOTES
v1.0 — Initial release. LazyBear's Squeeze Momentum Indicator computed as TradingView shows it and with the 2014 typo fixed, three rules (the creator's, the classic, the improved) logged on both codes, a six-row comparison table, trades drawn on the chart, two alert hooks and JSON alerts.
🔶 OVERVIEW
Squeeze Verdict Lab puts the Squeeze Momentum Indicator by LazyBear on trial on your own chart. It draws LazyBear's indicator with the same inputs and formulas, trades the three ways traders use it side by side, and logs every trade of each rule twice: once on the code as TradingView shows it, and once with the typo LazyBear flagged in 2014 fixed. One table shows all six logs over the last N trades, so you can see which rule, on which code, holds up on your market and timeframe.
Credit: the indicator part is the open-source "Squeeze Momentum Indicator [LazyBear]" (after John Carter's TTM Squeeze), reproduced with the same inputs and formulas. The rule logs, the two-code comparison, the stops and the table are the original work described below.
🔶 THE INDICATOR AND THE TYPO
- Squeeze ON (black cross on the zero line): the Bollinger Bands (20) are inside the Keltner Channel (20, 1.5 × true range). The market is coiling.
- Squeeze released (grey cross): the bands are back outside the channel. Neither: blue cross. (On a dark chart the script draws these two orange and white by default; see Cross colours.)
- The histogram is the momentum: a linear regression (20) of the close minus the average of the 20-candle midrange and the 20 SMA. Bright green: above zero and rising. Dark green: above zero and falling. Bright red: below zero and falling. Dark red: below zero and rising.
- The typo: the code TradingView shows builds the Bollinger width with the KC multiplier (1.5) instead of the BB multiplier, so the "BB MultFactor" input does nothing. LazyBear's note of 29 Sep 2014 says to use the updated source instead. This script computes the squeeze both ways: AS SHOWN (1.5) and FIXED (the BB MultFactor, 2.0 by default). The narrower bands of the typo put the market "in a squeeze" far more often.
🔶 THE THREE RULES
A. The creator's rule: the first grey cross after a black cross, in the direction of the momentum (histogram above zero = long, below = short). Exit at the close of the first candle whose histogram colour differs from the entry candle's.
B. The classic rule: the first grey cross after a black cross on a bright bar (bright green = long, bright red = short). Target 2R.
C. The improved rule: rule B, plus at least 6 black crosses in a row before the grey one, and the close above the 200 SMA for a long, below it for a short. Target 2R.
Every rule's stop sits at the 10-candle swing (the lowest low for a long, the highest high for a short, the signal candle included) and is never closer than 0.5 × ATR(14). That distance is 1R. One trade at a time per log. Every entry, stop and exit is evaluated on closed candles; when one candle touches both the stop and the target, the stop counts first.
NON-REPAINTING: everything is evaluated on barstate.isconfirmed; there is no request.security and no lookahead.
🔶 THE TABLE
Six rows (A, B and C, each as shown and fixed) over the last N trades of each log (100 by default): trades, wins, win rate, total R and the number of days the log covers. The log you choose is also drawn on the price chart: entry, stop, target and the result of every trade.
🔶 SETTINGS
Squeeze Momentum (LazyBear)
- BB length (20), BB MultFactor (2.0, used by the FIXED code only), KC length (20), KC MultFactor (1.5), use true range (on).
- Crosses drawn in the pane: as TradingView shows it, or the fixed code.
Rules
- Rule C: black crosses in a row before the grey one (6), trend SMA length (200).
- Which log is drawn on the chart; take longs, take shorts.
Stop and target
- Swing lookback (10), minimum stop distance (0.5 × ATR 14), target for rules B and C (2R), how far open trade boxes extend.
Log
- Log size (the last 100 trades per log), table on or off, position and text size.
Visual
- Cross colours: Auto (default), LazyBear (black / grey) or High contrast (orange / white). Auto reads the chart background: on a dark chart the squeeze-on crosses are drawn orange and the released ones white, because black crosses cannot be seen there; on a light chart they stay black and grey as in LazyBear's script.
- Histogram colours, trade colours, trades kept on the chart, box transparency.
🔶 ALERTS
Two alertcondition hooks (long entry, short entry) for the drawn log. With JSON alerts on, every entry and exit of the drawn log also fires an alert() once per bar close with a JSON body (action, log, ticker, timeframe, entry, stop or result).
🔶 LIMITATIONS
- Results depend on the market, the timeframe, the code version and the settings; the table shows them on your own chart, losses included.
- The table counts the script's own rules on closed candles: no spread, no commission, no slippage, and the stop is counted before the target on a candle that touches both.
- The last-N window covers different calendar spans on different timeframes (two weeks of 5-minute candles can hold as many trades as two years of 1-hour candles).
- This is an analysis tool, not financial advice, and past performance does not guarantee future results. Test on your own market and timeframe before relying on any signal.
🔶 RELEASE NOTES
v1.0 — Initial release. LazyBear's Squeeze Momentum Indicator computed as TradingView shows it and with the 2014 typo fixed, three rules (the creator's, the classic, the improved) logged on both codes, a six-row comparison table, trades drawn on the chart, two alert hooks and JSON alerts.
版本注释
v1.0.1: Tidied the comments in the code header. Calculations, inputs, signals, the table and alerts are unchanged.
🔵Gain access to our powerful tools : kestutisbalciunas.com/tradingview/
🔵Join our free telegram for updates : t.me/algotradingedge
All scripts & content provided by Forexobroker are for informational & educational purposes only.
🔵Join our free telegram for updates : t.me/algotradingedge
All scripts & content provided by Forexobroker are for informational & educational purposes only.
免责声明
这些信息和出版物并非旨在提供,也不构成TradingView提供或认可的任何形式的财务、投资、交易或其他类型的建议或推荐。请阅读使用条款了解更多信息。
🔵Gain access to our powerful tools : kestutisbalciunas.com/tradingview/
🔵Join our free telegram for updates : t.me/algotradingedge
All scripts & content provided by Forexobroker are for informational & educational purposes only.
🔵Join our free telegram for updates : t.me/algotradingedge
All scripts & content provided by Forexobroker are for informational & educational purposes only.
免责声明
这些信息和出版物并非旨在提供,也不构成TradingView提供或认可的任何形式的财务、投资、交易或其他类型的建议或推荐。请阅读使用条款了解更多信息。