OPEN-SOURCE SCRIPT
SMC Market Structure Regime [Dots3Red]
Most traders can spot BOS and CHoCH.
Reading the CURRENT market regime in real time is much harder.
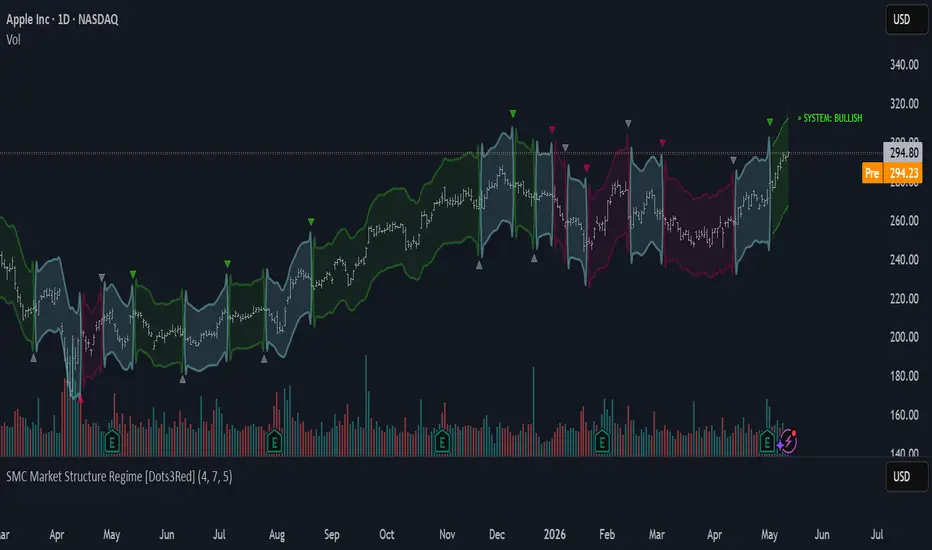
SMC Market Structure Regime transforms raw price structure into a dynamic visual system — highlighting bullish, bearish, and weakening phases using adaptive boundaries and smart-money logic.
Built for traders who want cleaner SMC visualization without cluttered charts.
─────────────────────────────────
FEATURES
─────────────────────────────────
◆ Smart Money Structure Detection
◆ Adaptive Structure Boundaries
◆ Real-Time Regime Projection
◆ Clean Visual Design
─────────────────────────────────
HOW TO READ
─────────────────────────────────
▲ Green Zone — Bullish Regime
HH + HL structure confirmed. Market is in bullish continuation.
▼ Red Zone — Bearish Regime
LH + LL structure confirmed. Market is in bearish continuation.
◆ Teal Zone — Neutral / Transition
Structure is resetting. Wait for BOS confirmation before committing.
⚠ Orange Warning — Weakening Structure
Current regime is showing signs of exhaustion. Possible CHoCH incoming.
BOS Label
Structure continuation confirmed in the direction of the regime.
»CHoCH« Label
Character of the market is changing. Possible reversal forming.
─────────────────────────────────
SETTINGS
─────────────────────────────────
Pivot Length
Controls sensitivity of swing detection.
Lower = more sensitive, higher = smoother structure.
Boundary Offset %
Controls how wide the envelope sits around price.
Increase for volatile assets, decrease for tight structure.
Boundary Smoothing
EMA period for boundary curves.
Lower = reactive, higher = smooth channel look.
─────────────────────────────────
BEST USED WITH
─────────────────────────────────
─────────────────────────────────
NOTES
─────────────────────────────────
This indicator is a visualization and context tool.
It works best as part of a broader SMC framework — not as a standalone signal.
No indicator constitutes financial advice. Trade responsibly.
Reading the CURRENT market regime in real time is much harder.
SMC Market Structure Regime transforms raw price structure into a dynamic visual system — highlighting bullish, bearish, and weakening phases using adaptive boundaries and smart-money logic.
Built for traders who want cleaner SMC visualization without cluttered charts.
─────────────────────────────────
FEATURES
─────────────────────────────────
◆ Smart Money Structure Detection
- Automatic BOS (Break of Structure) detection
- CHoCH (Change of Character) transitions
- Bullish / Bearish / Neutral regime tracking
◆ Adaptive Structure Boundaries
- Smoothed curved regime envelopes
- Dynamic offset zones that breathe with price
- Visual market phase mapping
◆ Real-Time Regime Projection
- Live regime state on the last bar
- Detects weakening structure conditions
- Highlights possible transition phases before they confirm
◆ Clean Visual Design
- Minimal chart clutter
- Cyberpunk-inspired color system — fast visual reads
- Designed for speed, not noise
─────────────────────────────────
HOW TO READ
─────────────────────────────────
▲ Green Zone — Bullish Regime
HH + HL structure confirmed. Market is in bullish continuation.
▼ Red Zone — Bearish Regime
LH + LL structure confirmed. Market is in bearish continuation.
◆ Teal Zone — Neutral / Transition
Structure is resetting. Wait for BOS confirmation before committing.
⚠ Orange Warning — Weakening Structure
Current regime is showing signs of exhaustion. Possible CHoCH incoming.
BOS Label
Structure continuation confirmed in the direction of the regime.
»CHoCH« Label
Character of the market is changing. Possible reversal forming.
─────────────────────────────────
SETTINGS
─────────────────────────────────
Pivot Length
Controls sensitivity of swing detection.
Lower = more sensitive, higher = smoother structure.
Boundary Offset %
Controls how wide the envelope sits around price.
Increase for volatile assets, decrease for tight structure.
Boundary Smoothing
EMA period for boundary curves.
Lower = reactive, higher = smooth channel look.
─────────────────────────────────
BEST USED WITH
─────────────────────────────────
- Higher timeframe bias confirmation
- Liquidity zone mapping
- Volume analysis
- Order block confirmation
- Intraday and swing trading setups
─────────────────────────────────
NOTES
─────────────────────────────────
This indicator is a visualization and context tool.
It works best as part of a broader SMC framework — not as a standalone signal.
No indicator constitutes financial advice. Trade responsibly.
开源脚本
秉承TradingView的精神,该脚本的作者将其开源,以便交易者可以查看和验证其功能。向作者致敬!您可以免费使用该脚本,但请记住,重新发布代码须遵守我们的网站规则。

Connect the dots to elevate your trading.
免责声明
这些信息和出版物并非旨在提供,也不构成TradingView提供或认可的任何形式的财务、投资、交易或其他类型的建议或推荐。请阅读使用条款了解更多信息。
开源脚本
秉承TradingView的精神,该脚本的作者将其开源,以便交易者可以查看和验证其功能。向作者致敬!您可以免费使用该脚本,但请记住,重新发布代码须遵守我们的网站规则。
Connect the dots to elevate your trading.
免责声明
这些信息和出版物并非旨在提供,也不构成TradingView提供或认可的任何形式的财务、投资、交易或其他类型的建议或推荐。请阅读使用条款了解更多信息。