Buy/Sell Signals: SMA + Volume + Trade Profit
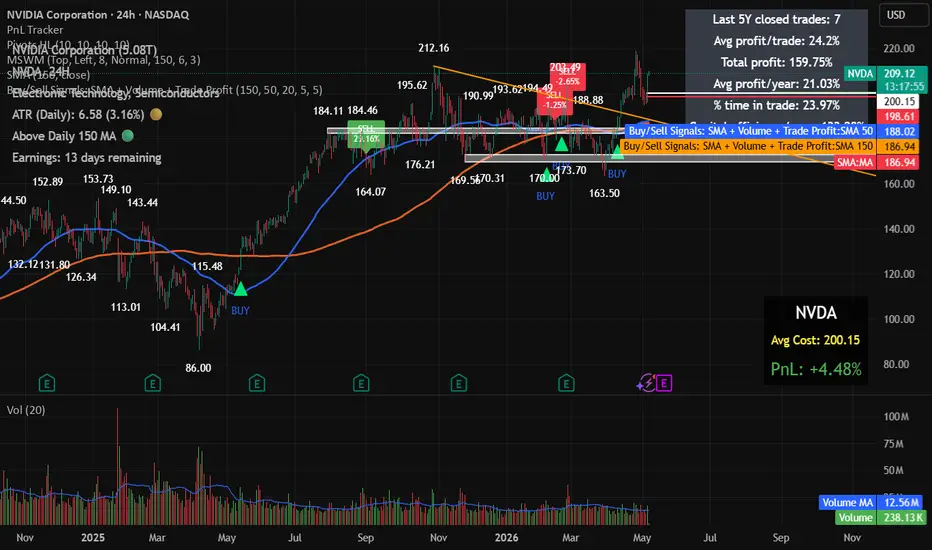
This indicator generates buy and sell signals using SMA 150, SMA 50, candle color, and volume conditions.
A buy signal appears when a green candle closes above the SMA 150, remains within the selected maximum percentage above it, closes above the SMA 50, and has above-average volume.
A sell signal appears on the first candle that closes below the SMA 50 after a buy signal.
The indicator tracks each completed trade and displays the profit/loss percentage on the sell candle. It also includes a summary table showing trade count, average profit, total compounded profit, average yearly profit, time spent in trades, and yearly capital-efficiency adjusted for exposure time.
The checked time period is configurable in years.
A buy signal appears when a green candle closes above the SMA 150, remains within the selected maximum percentage above it, closes above the SMA 50, and has above-average volume.
A sell signal appears on the first candle that closes below the SMA 50 after a buy signal.
The indicator tracks each completed trade and displays the profit/loss percentage on the sell candle. It also includes a summary table showing trade count, average profit, total compounded profit, average yearly profit, time spent in trades, and yearly capital-efficiency adjusted for exposure time.
The checked time period is configurable in years.

免责声明
这些信息和出版物并非旨在提供,也不构成TradingView提供或认可的任何形式的财务、投资、交易或其他类型的建议或推荐。请阅读使用条款了解更多信息。