OPEN-SOURCE SCRIPT
已更新 OS RSI Envelope
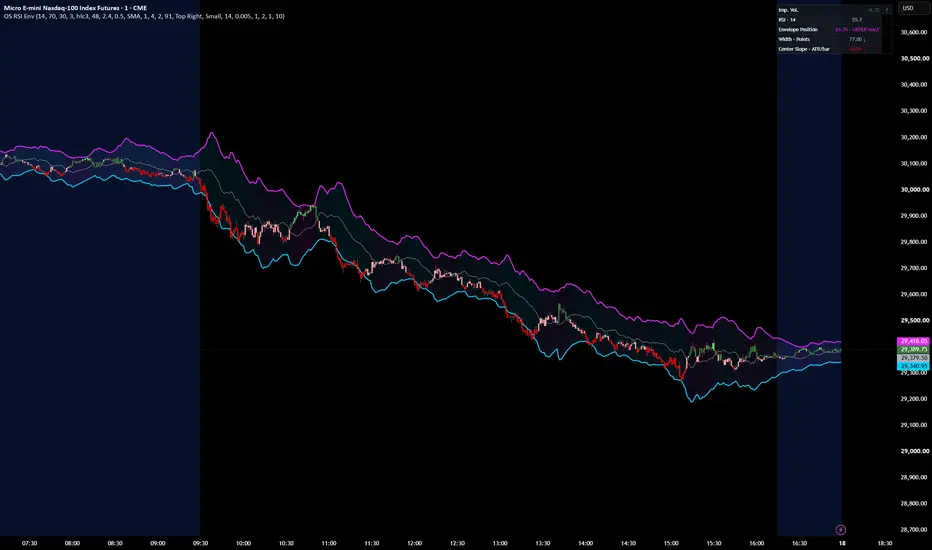
RSI Envelope
The OS RSI Envelope projects dynamic price boundaries where the selected RSI would reach its upper or lower threshold.
With the default 14-period RSI and 70/30 thresholds, the upper boundary represents the price level associated with RSI reaching 70, and the lower boundary represents the level associated with RSI reaching 30.
The boundaries adapt as recent upward and downward price movement changes.
Light smoothing can make them easier to read.
This is a price overlay, not a traditional volatility band.
Its boundaries provide context for where price sits relative to RSI pressure levels; they do not predict reversals or guarantee that price will turn.
How to interpret it
- Between the boundaries: Price is inside the envelope. Its dashboard position shows where it sits: 0% at the lower boundary, 50% at the center, and 100% at the upper boundary.
- Below 0% or above 100%: Price is outside the envelope. This marks movement beyond the projected RSI threshold level; it is not, by itself, a reversal signal.
- Envelope width: The distance between the upper and lower boundaries in price points. Widening means that distance is increasing; narrowing means it is decreasing.
- Center slope: The envelope midpoint’s one-bar change divided by ATR. The arrow and color show whether the midpoint is rising, falling, or relatively flat.
In a strong trend, price can stay near or beyond a boundary. Read the envelope alongside price action and other context; don’t treat a boundary touch alone as a buy or sell signal.
版本注释
Updated Impulse Volume CandlesImpulse Volume calculations and candle-color logic adapted from [Impulse Volume Oscillator by AlphaExtract](tradingview.com/script/toO8ErhY-Impulse-Volume-Oscillator-Alpha-Extract/). Licensed under the Mozilla Public License 2.0. Integrated and modified for OS Market Compass.
开源脚本
秉承TradingView的精神,该脚本的作者将其开源,以便交易者可以查看和验证其功能。向作者致敬!您可以免费使用该脚本,但请记住,重新发布代码须遵守我们的网站规则。

免责声明
这些信息和出版物并非旨在提供,也不构成TradingView提供或认可的任何形式的财务、投资、交易或其他类型的建议或推荐。请阅读使用条款了解更多信息。
免责声明
这些信息和出版物并非旨在提供,也不构成TradingView提供或认可的任何形式的财务、投资、交易或其他类型的建议或推荐。请阅读使用条款了解更多信息。