OPEN-SOURCE SCRIPT
已更新 TPI 15m ONLY
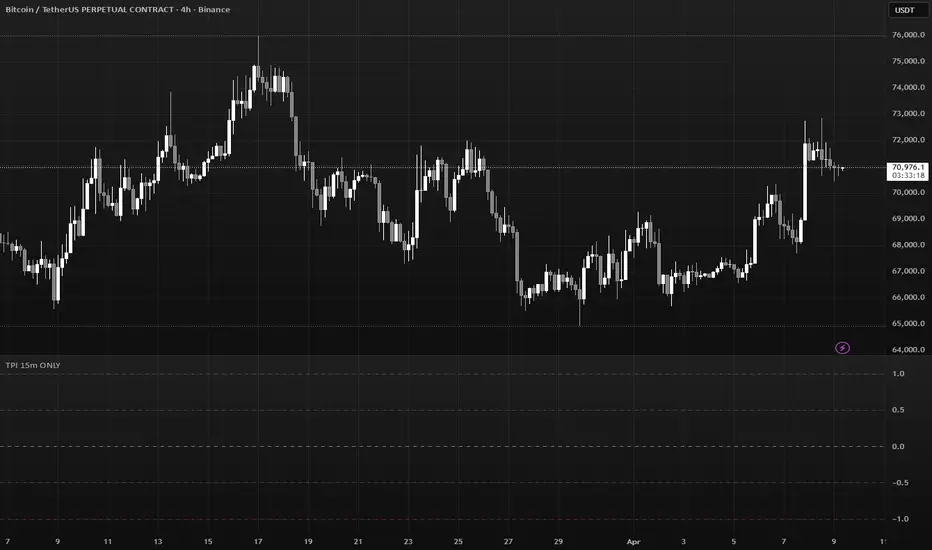
TPI (Trend Power Index) is a multi-factor momentum and structure indicator designed to measure overall market bias using trend structure, momentum, and moving averages.
The script combines six independent components into one normalized score between -1 and +1, giving a quick visual overview of bullish or bearish strength.
The indicator is optimized to work with 15 minute trading, while also incorporating higher timeframe structure.
Core Components
1. Multi-Timeframe Market Structure (BOS / MSB)
The script builds dynamic swing highs and swing lows and detects:
BOS (Break of Structure)
MSB (Market Structure Break)
These signals determine the trend direction on:
4H
1H
15M
Each timeframe contributes to the final trend score.
2. Supertrend Bias (30m)
A 30 minute Supertrend is used as a higher timeframe trend filter.
Price above Supertrend → Bullish score
Price below Supertrend → Bearish score
3. TSI Momentum (15m)
A True Strength Index measures momentum strength.
Conditions used:
TSI above signal line
TSI above or below zero
This creates graded momentum scoring.
4. EMA Structure (15m)
Two EMAs are used:
EMA 18
EMA 36
Scoring depends on:
EMA alignment
Price position relative to both EMAs
This captures short-term directional pressure.
Final TPI Calculation
All components are averaged:
TPI = (4H trend + 1H trend + 15M trend + TSI + EMA + Supertrend) / 6
The result is a continuous score between -1 and +1.
Visualization
The indicator plots colored dots representing trend strength.
Color intensity reflects the magnitude of the TPI score:
Dark Green → Strong bullish alignment
Light Green → Mild bullish bias
Gray → Neutral / mixed signals
Light Red → Mild bearish bias
Dark Red → Strong bearish alignment
Horizontal reference levels:
+1.0 → Maximum bullish alignment
+0.5 → Moderate bullish bias
0.0 → Neutral
-0.5 → Moderate bearish bias
-1.0 → Maximum bearish alignment
Intended Use
TPI is designed to help traders quickly identify:
Market alignment across timeframes
Momentum confirmation
Trend strength
Potential trend transitions
It works well as a trend filter, bias indicator, or confirmation tool for discretionary strategies.
The script combines six independent components into one normalized score between -1 and +1, giving a quick visual overview of bullish or bearish strength.
The indicator is optimized to work with 15 minute trading, while also incorporating higher timeframe structure.
Core Components
1. Multi-Timeframe Market Structure (BOS / MSB)
The script builds dynamic swing highs and swing lows and detects:
BOS (Break of Structure)
MSB (Market Structure Break)
These signals determine the trend direction on:
4H
1H
15M
Each timeframe contributes to the final trend score.
2. Supertrend Bias (30m)
A 30 minute Supertrend is used as a higher timeframe trend filter.
Price above Supertrend → Bullish score
Price below Supertrend → Bearish score
3. TSI Momentum (15m)
A True Strength Index measures momentum strength.
Conditions used:
TSI above signal line
TSI above or below zero
This creates graded momentum scoring.
4. EMA Structure (15m)
Two EMAs are used:
EMA 18
EMA 36
Scoring depends on:
EMA alignment
Price position relative to both EMAs
This captures short-term directional pressure.
Final TPI Calculation
All components are averaged:
TPI = (4H trend + 1H trend + 15M trend + TSI + EMA + Supertrend) / 6
The result is a continuous score between -1 and +1.
Visualization
The indicator plots colored dots representing trend strength.
Color intensity reflects the magnitude of the TPI score:
Dark Green → Strong bullish alignment
Light Green → Mild bullish bias
Gray → Neutral / mixed signals
Light Red → Mild bearish bias
Dark Red → Strong bearish alignment
Horizontal reference levels:
+1.0 → Maximum bullish alignment
+0.5 → Moderate bullish bias
0.0 → Neutral
-0.5 → Moderate bearish bias
-1.0 → Maximum bearish alignment
Intended Use
TPI is designed to help traders quickly identify:
Market alignment across timeframes
Momentum confirmation
Trend strength
Potential trend transitions
It works well as a trend filter, bias indicator, or confirmation tool for discretionary strategies.
版本注释
.版本注释
Contact me in private if you need the indicator版本注释
Contact me in private if you need the indicator开源脚本
秉承TradingView的精神,该脚本的作者将其开源,以便交易者可以查看和验证其功能。向作者致敬!您可以免费使用该脚本,但请记住,重新发布代码须遵守我们的网站规则。

免责声明
这些信息和出版物并非旨在提供,也不构成TradingView提供或认可的任何形式的财务、投资、交易或其他类型的建议或推荐。请阅读使用条款了解更多信息。
免责声明
这些信息和出版物并非旨在提供,也不构成TradingView提供或认可的任何形式的财务、投资、交易或其他类型的建议或推荐。请阅读使用条款了解更多信息。