OPEN-SOURCE SCRIPT
Trend Alignment Ribbon - Multi Timeframe Moving Averages
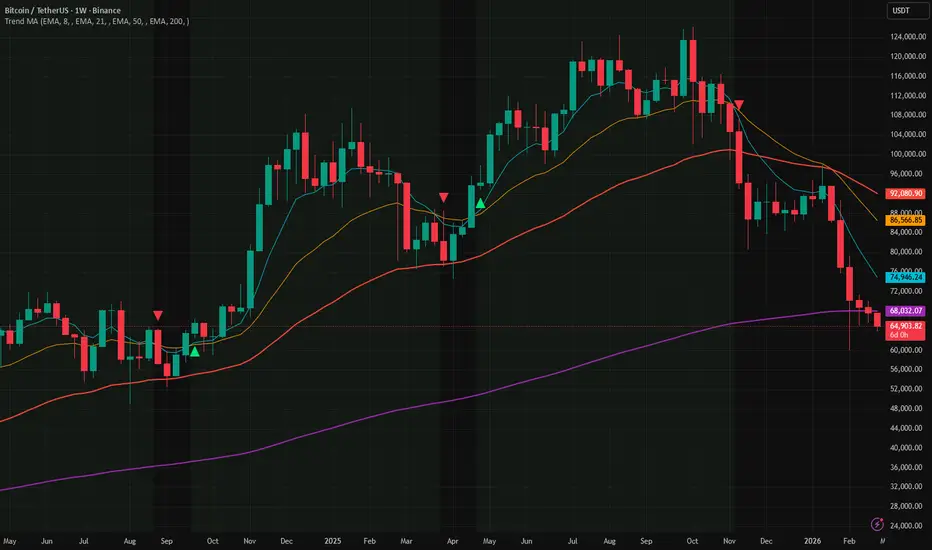
Track trend direction across multiple timeframes — all in one view.
Trend trading works best when the short, medium, and long-term views all agree. This indicator places four moving averages on your chart simultaneously and highlights the moment they fall into full alignment — giving you a simple, visual confirmation that a trend is in control.
──── What You're Looking At ────
Four smooth lines on your chart, each tracking price at a different speed:
──── How to Read It ────
──── Multi-Timeframe Mode ────
Each of the four lines can be pinned to a different timeframe, independent of the chart you are on. For example, while viewing a 15-minute chart you can display the 200-bar average as it appears on the daily chart — so the big picture is always visible.
Leave the Timeframe field blank to use the current chart's timeframe (default behaviour).
──── Settings ────
Each moving average has its own settings group (Moving Average 1–4):
Under Visuals:
──── Alerts ────
──── Tips ────
Trend trading works best when the short, medium, and long-term views all agree. This indicator places four moving averages on your chart simultaneously and highlights the moment they fall into full alignment — giving you a simple, visual confirmation that a trend is in control.
──── What You're Looking At ────
Four smooth lines on your chart, each tracking price at a different speed:
- MA1 (fastest, default: 8 bars) — reacts quickly to price. The first line to turn when momentum shifts.
- MA2 (default: 21 bars) — short-to-intermediate direction. Confirms or challenges what MA1 is saying.
- MA3 (default: 50 bars) — the medium-term trend backbone. Widely watched by institutions.
- MA4 (slowest, default: 200 bars) — the long-term trend anchor. The most important line on most charts.
──── How to Read It ────
- Green background — all four lines are stacked in order, fastest on top. The trend is strongly up. High-confidence environment for long trades.
- Red background — all four lines are stacked in reverse order. The trend is strongly down. High-confidence environment for short trades.
- No background — the lines are tangled or out of order. The market is ranging or in transition. Reduce risk or wait for clarity.
- Triangle up ▲ below a candle — the fast line just crossed above the medium line. Early momentum shift to the upside.
- Triangle down ▼ above a candle — the fast line just crossed below the medium line. Early momentum shift to the downside.
──── Multi-Timeframe Mode ────
Each of the four lines can be pinned to a different timeframe, independent of the chart you are on. For example, while viewing a 15-minute chart you can display the 200-bar average as it appears on the daily chart — so the big picture is always visible.
Leave the Timeframe field blank to use the current chart's timeframe (default behaviour).
──── Settings ────
Each moving average has its own settings group (Moving Average 1–4):
- Show — toggle each line on or off independently.
- Type — choose between four calculation methods:
- EMA (Exponential) — reacts faster to recent price. Most commonly used. Default.
- SMA (Simple) — a plain average of all bars. Slower to react, widely respected by institutions.
- WMA (Weighted) — middle ground, heavier weight on recent bars.
- HMA (Hull) — very fast and smooth. Minimises lag while reducing noise.
- Length — how many bars are included in the average. Higher number = slower, smoother line.
- Timeframe — leave blank for the current chart. Enter 1D for daily, 1W for weekly, 4H for four-hour, etc.
- Color — fully customisable per line.
Under Visuals:
- Ribbon Fill — fills the space between MA1 and MA4 with a transparent green or red shade. Useful for seeing trend strength at a glance.
- Alignment Background — highlights the chart background when all 4 lines agree on direction. On by default.
- Cross Signals — places small triangle markers on the chart when MA1 and MA2 cross. On by default.
──── Alerts ────
- MA Bull Cross — the fast line crossed above the medium line
- MA Bear Cross — the fast line crossed below the medium line
- Full Bull Alignment — all 4 lines just entered bullish order for the first time
- Full Bear Alignment — all 4 lines just entered bearish order for the first time
──── Tips ────
- Set an alert for Full Alignment — these moments often mark the start of the strongest, cleanest trend moves on any instrument.
- A cross signal that fires while the alignment background is already lit is a higher-confidence entry than a cross signal in a mixed or choppy environment.
- A "tight stack" of closely spaced lines means the trend is young and orderly. Wide spacing with tangled lines means the market is extended or breaking down — not an ideal entry point.
- On intraday charts, try pinning MA3 or MA4 to the daily timeframe. This keeps your long-term bias anchored without switching charts.
- All timeframe calculations use confirmed (closed) bars only — there is no repainting.
开源脚本
秉承TradingView的精神,该脚本的作者将其开源,以便交易者可以查看和验证其功能。向作者致敬!您可以免费使用该脚本,但请记住,重新发布代码须遵守我们的网站规则。

免责声明
这些信息和出版物并非旨在提供,也不构成TradingView提供或认可的任何形式的财务、投资、交易或其他类型的建议或推荐。请阅读使用条款了解更多信息。
开源脚本
秉承TradingView的精神,该脚本的作者将其开源,以便交易者可以查看和验证其功能。向作者致敬!您可以免费使用该脚本,但请记住,重新发布代码须遵守我们的网站规则。
免责声明
这些信息和出版物并非旨在提供,也不构成TradingView提供或认可的任何形式的财务、投资、交易或其他类型的建议或推荐。请阅读使用条款了解更多信息。