OPEN-SOURCE SCRIPT
已更新 VIDYA + Fisher Trend System [Custom]
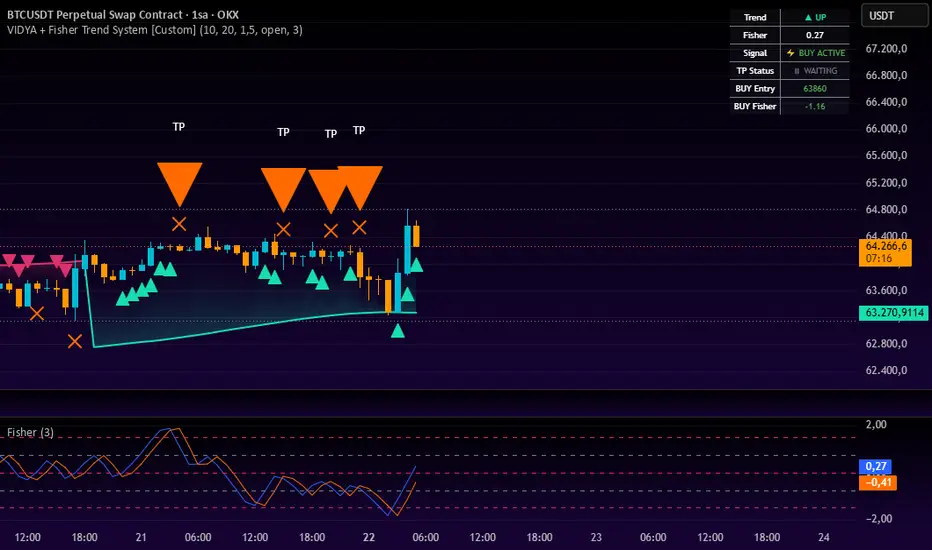
VIDYA + Fisher Trend System [Custom]
A powerful trend-following system combining Volumatic VIDYA with Fisher Transform for high-probability entry signals
📊 Overview
This indicator is a comprehensive trading system that combines two proven technical analysis tools:
VIDYA (Variable Index Dynamic Average) - A smart moving average that adapts to market volatility
Fisher Transform - A mathematical transformation that converts price data into a Gaussian normal distribution
The system uses VIDYA to determine trend direction and the Fisher Transform to generate precise entry signals with take-profit targets.
🎯 Core Concept
The indicator operates on a dual-layer approach:
Trend Layer (VIDYA): Dynamically identifies market trend using Volumatic VIDYA with adaptive bands
Signal Layer (Fisher Transform): Generates entry and exit signals based on Fisher crossovers at key levels
🟢 BUY Signal Conditions:
Trend is UP (price above lower VIDYA band)
Fisher is below 0 (oversold condition)
Fisher line crosses above Trigger line (momentum shift)
🔴 SELL Signal Conditions:
Trend is DOWN (price below upper VIDYA band)
Fisher is above 0 (overbought condition)
Fisher line crosses below Trigger line (momentum shift)
🎯 Take-Profit System
The indicator includes an intelligent take-profit mechanism:
After a BUY signal: TP triggers when Fisher crosses below Trigger (momentum exhaustion)
After a SELL signal: TP triggers when Fisher crosses above Trigger (momentum exhaustion)
Each position tracks entry Fisher value for reference
🔧 Input Parameters
VIDYA Settings
Parameter Description Default
VIDYA Length Calculation period for VIDYA 10
VIDYA Momentum Momentum period for volatility adjustment 20
Distance Factor Multiplier for upper/lower bands 2.0
Fisher Transform Settings
Parameter Description Default
Fisher Length Period for Fisher calculation 9
Visual Settings
Parameter Description Default
Up Trend Color Color for uptrend visualization Green
Down Trend Color Color for downtrend visualization Red
Shadow Enable/disable trend fill True
📈 Visualization
Main Chart
VIDYA Trend Line: Dynamic trend line colored by direction
BUY Signals: Green triangle pointing up with "BUY" text
SELL Signals: Red triangle pointing down with "SELL" text
TP Signals: Orange triangle with "TP" text
Trend Fill: Semi-transparent fill between price and trend line
Fisher Pane (Separate Window)
Fisher Line (Blue): Main Fisher Transform value
Trigger Line (Orange): Previous Fisher value
Key Levels: 1.5, 0.75, 0, -0.75, -1.5 (dashed lines)
Signal Markers: Small triangles at signal points
Information Table (Top-Right)
Current trend direction
Latest Fisher value with color coding
Trading status (BUY/SELL opportunity or WAIT)
TP status (Active/Waiting)
Entry Fisher values for open positions
🚨 Alert Conditions
The indicator provides comprehensive alert conditions:
🔵 BUY Signal
🔴 SELL Signal
📈 Trend Turned UP
📉 Trend Turned DOWN
🎯 BUY TP Signal (Take Profit)
🎯 SELL TP Signal (Take Profit)
💡 How to Use
1. Trend Identification
Uptrend: Green trend line, price above lower band
Downtrend: Red trend line, price below upper band
2. Entry Signals
Wait for trend confirmation
Enter on BUY/SELL signals
Use Fisher values for position management
3. Risk Management
Use TP signals to take profits
Monitor Fisher levels for extreme conditions (±1.5)
Adjust position sizing based on trend strength
🔍 Technical Explanation
VIDYA (Variable Index Dynamic Average)
VIDYA adapts to market volatility using the Chande Momentum Oscillator (CMO). Unlike traditional moving averages, VIDYA becomes more responsive during volatile periods and smoother during quiet periods, making it ideal for trend identification.
Fisher Transform
The Fisher Transform normalizes price data, making price movements more apparent. It helps identify turning points by highlighting when prices reach extreme levels (overbought/oversold) and when momentum shifts occur.
⚠️ Important Notes
This is a trend-following system - performs best in trending markets
May produce false signals in ranging/choppy markets
Always use proper risk management and position sizing
Best used in conjunction with other analysis tools
Default settings are optimized for daily timeframes - adjust for other timeframes
🏆 Credits
This indicator is inspired by and incorporates elements from:
BigBelluga - Original VIDYA concept and implementation
John Ehlers - Fisher Transform mathematical framework
The combination of these two powerful tools creates a robust system that adapts to market conditions while providing clear, actionable signals.
🔄 Version History
v1.0 - Initial release
VIDYA trend detection with adaptive bands
Fisher Transform signal generation
Integrated take-profit system
Full alert conditions
Interactive information table
📝 Disclaimer
This indicator is for educational and informational purposes only. It does not constitute financial advice. Always conduct your own research and analysis before making trading decisions. Past performance does not guarantee future results.
A powerful trend-following system combining Volumatic VIDYA with Fisher Transform for high-probability entry signals
📊 Overview
This indicator is a comprehensive trading system that combines two proven technical analysis tools:
VIDYA (Variable Index Dynamic Average) - A smart moving average that adapts to market volatility
Fisher Transform - A mathematical transformation that converts price data into a Gaussian normal distribution
The system uses VIDYA to determine trend direction and the Fisher Transform to generate precise entry signals with take-profit targets.
🎯 Core Concept
The indicator operates on a dual-layer approach:
Trend Layer (VIDYA): Dynamically identifies market trend using Volumatic VIDYA with adaptive bands
Signal Layer (Fisher Transform): Generates entry and exit signals based on Fisher crossovers at key levels
🟢 BUY Signal Conditions:
Trend is UP (price above lower VIDYA band)
Fisher is below 0 (oversold condition)
Fisher line crosses above Trigger line (momentum shift)
🔴 SELL Signal Conditions:
Trend is DOWN (price below upper VIDYA band)
Fisher is above 0 (overbought condition)
Fisher line crosses below Trigger line (momentum shift)
🎯 Take-Profit System
The indicator includes an intelligent take-profit mechanism:
After a BUY signal: TP triggers when Fisher crosses below Trigger (momentum exhaustion)
After a SELL signal: TP triggers when Fisher crosses above Trigger (momentum exhaustion)
Each position tracks entry Fisher value for reference
🔧 Input Parameters
VIDYA Settings
Parameter Description Default
VIDYA Length Calculation period for VIDYA 10
VIDYA Momentum Momentum period for volatility adjustment 20
Distance Factor Multiplier for upper/lower bands 2.0
Fisher Transform Settings
Parameter Description Default
Fisher Length Period for Fisher calculation 9
Visual Settings
Parameter Description Default
Up Trend Color Color for uptrend visualization Green
Down Trend Color Color for downtrend visualization Red
Shadow Enable/disable trend fill True
📈 Visualization
Main Chart
VIDYA Trend Line: Dynamic trend line colored by direction
BUY Signals: Green triangle pointing up with "BUY" text
SELL Signals: Red triangle pointing down with "SELL" text
TP Signals: Orange triangle with "TP" text
Trend Fill: Semi-transparent fill between price and trend line
Fisher Pane (Separate Window)
Fisher Line (Blue): Main Fisher Transform value
Trigger Line (Orange): Previous Fisher value
Key Levels: 1.5, 0.75, 0, -0.75, -1.5 (dashed lines)
Signal Markers: Small triangles at signal points
Information Table (Top-Right)
Current trend direction
Latest Fisher value with color coding
Trading status (BUY/SELL opportunity or WAIT)
TP status (Active/Waiting)
Entry Fisher values for open positions
🚨 Alert Conditions
The indicator provides comprehensive alert conditions:
🔵 BUY Signal
🔴 SELL Signal
📈 Trend Turned UP
📉 Trend Turned DOWN
🎯 BUY TP Signal (Take Profit)
🎯 SELL TP Signal (Take Profit)
💡 How to Use
1. Trend Identification
Uptrend: Green trend line, price above lower band
Downtrend: Red trend line, price below upper band
2. Entry Signals
Wait for trend confirmation
Enter on BUY/SELL signals
Use Fisher values for position management
3. Risk Management
Use TP signals to take profits
Monitor Fisher levels for extreme conditions (±1.5)
Adjust position sizing based on trend strength
🔍 Technical Explanation
VIDYA (Variable Index Dynamic Average)
VIDYA adapts to market volatility using the Chande Momentum Oscillator (CMO). Unlike traditional moving averages, VIDYA becomes more responsive during volatile periods and smoother during quiet periods, making it ideal for trend identification.
Fisher Transform
The Fisher Transform normalizes price data, making price movements more apparent. It helps identify turning points by highlighting when prices reach extreme levels (overbought/oversold) and when momentum shifts occur.
⚠️ Important Notes
This is a trend-following system - performs best in trending markets
May produce false signals in ranging/choppy markets
Always use proper risk management and position sizing
Best used in conjunction with other analysis tools
Default settings are optimized for daily timeframes - adjust for other timeframes
🏆 Credits
This indicator is inspired by and incorporates elements from:
BigBelluga - Original VIDYA concept and implementation
John Ehlers - Fisher Transform mathematical framework
The combination of these two powerful tools creates a robust system that adapts to market conditions while providing clear, actionable signals.
🔄 Version History
v1.0 - Initial release
VIDYA trend detection with adaptive bands
Fisher Transform signal generation
Integrated take-profit system
Full alert conditions
Interactive information table
📝 Disclaimer
This indicator is for educational and informational purposes only. It does not constitute financial advice. Always conduct your own research and analysis before making trading decisions. Past performance does not guarantee future results.
版本注释
The repaint issue on the indicator has been fixed.开源脚本
秉承TradingView的精神,该脚本的作者将其开源,以便交易者可以查看和验证其功能。向作者致敬!您可以免费使用该脚本,但请记住,重新发布代码须遵守我们的网站规则。

免责声明
这些信息和出版物并非旨在提供,也不构成TradingView提供或认可的任何形式的财务、投资、交易或其他类型的建议或推荐。请阅读使用条款了解更多信息。
免责声明
这些信息和出版物并非旨在提供,也不构成TradingView提供或认可的任何形式的财务、投资、交易或其他类型的建议或推荐。请阅读使用条款了解更多信息。