OPEN-SOURCE SCRIPT
Futures Rollover Volume Monitor
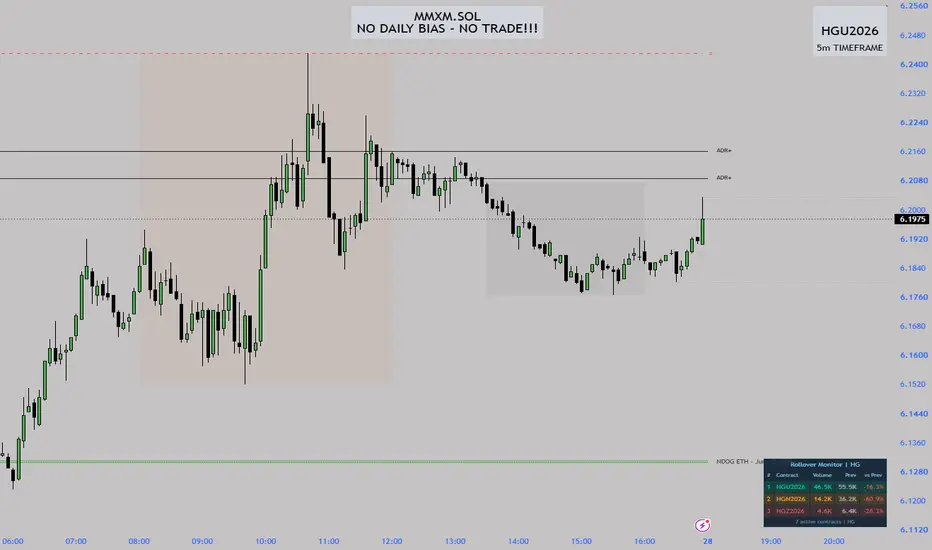
Futures Rollover Volume Monitor
This indicator helps futures traders identify the most actively traded contract months in real time and spot the exact moment when volume begins rotating from the front-month contract to the next one — the rollover window that typically occurs 1–2 weeks before expiry.
How it works
The script automatically detects the root symbol from whatever futures instrument is on your chart (GC, ES, NQ, CL, SI, HG, and any other futures root). It then builds a list of individual contract tickers across all 12-month codes (F G H J K M N Q U V X Z) for the selected start year and number of years to scan, fetches the daily volume for each one via request.security(), filters out expired contracts using their last bar timestamp, and ranks the remaining active contracts by volume. Only the top 3 are displayed.
Key features
Auto-detects root symbol — works on any futures instrument without manual configuration
Always uses daily volume so numbers match your watchlist regardless of chart timeframe
Filters expired contracts by checking whether the contract's last bar is more than 7 days old
Ranks top 3 active contracts by today's volume, highest at the top
Shows previous day's volume and percentage change vs previous day for each contract
Rollover alert fires when the 2nd contract reaches 80% or more of the front month volume, turning the table frame red and displaying a warning banner
All 12 month codes enabled by default so it works across different futures schedules (quarterly, monthly, or custom)
Fully customisable colours, table position, and text size
How to use
Add the indicator to any continuous or individual futures chart. The table updates automatically. When you see the 2nd-ranked contract closing the gap on the 1st — especially in the days approaching expiry — that is your signal that the market is beginning to roll. Once rank 1 and rank 2 are very close in volume, most professional traders have already begun rolling their positions to the next contract.
Settings
Start Year — the first year of contracts to scan (set to current year to avoid showing expired contracts from prior years)
Years to scan — how many years forward to include (1 or 2)
Active Month Codes — toggle individual months on or off to match the contract schedule of your instrument
Show Previous Bar Volume — toggle the Prev and vs Prev columns
Highlight Rollover Alert — toggle the red frame and banner when rollover is imminent
Position / Text Size / Colours — visual customisation
Notes
Requires TradingView Pro or higher due to the number of request.security() calls (24 per chart)
Best used on a daily chart or any intraday chart — volume is always fetched at the daily timeframe
If fewer than 3 active contracts are found the table will show only the contracts available
The footer displays how many active contracts were detected for the current instrument
This indicator helps futures traders identify the most actively traded contract months in real time and spot the exact moment when volume begins rotating from the front-month contract to the next one — the rollover window that typically occurs 1–2 weeks before expiry.
How it works
The script automatically detects the root symbol from whatever futures instrument is on your chart (GC, ES, NQ, CL, SI, HG, and any other futures root). It then builds a list of individual contract tickers across all 12-month codes (F G H J K M N Q U V X Z) for the selected start year and number of years to scan, fetches the daily volume for each one via request.security(), filters out expired contracts using their last bar timestamp, and ranks the remaining active contracts by volume. Only the top 3 are displayed.
Key features
Auto-detects root symbol — works on any futures instrument without manual configuration
Always uses daily volume so numbers match your watchlist regardless of chart timeframe
Filters expired contracts by checking whether the contract's last bar is more than 7 days old
Ranks top 3 active contracts by today's volume, highest at the top
Shows previous day's volume and percentage change vs previous day for each contract
Rollover alert fires when the 2nd contract reaches 80% or more of the front month volume, turning the table frame red and displaying a warning banner
All 12 month codes enabled by default so it works across different futures schedules (quarterly, monthly, or custom)
Fully customisable colours, table position, and text size
How to use
Add the indicator to any continuous or individual futures chart. The table updates automatically. When you see the 2nd-ranked contract closing the gap on the 1st — especially in the days approaching expiry — that is your signal that the market is beginning to roll. Once rank 1 and rank 2 are very close in volume, most professional traders have already begun rolling their positions to the next contract.
Settings
Start Year — the first year of contracts to scan (set to current year to avoid showing expired contracts from prior years)
Years to scan — how many years forward to include (1 or 2)
Active Month Codes — toggle individual months on or off to match the contract schedule of your instrument
Show Previous Bar Volume — toggle the Prev and vs Prev columns
Highlight Rollover Alert — toggle the red frame and banner when rollover is imminent
Position / Text Size / Colours — visual customisation
Notes
Requires TradingView Pro or higher due to the number of request.security() calls (24 per chart)
Best used on a daily chart or any intraday chart — volume is always fetched at the daily timeframe
If fewer than 3 active contracts are found the table will show only the contracts available
The footer displays how many active contracts were detected for the current instrument
开源脚本
秉承TradingView的精神,该脚本的作者将其开源,以便交易者可以查看和验证其功能。向作者致敬!您可以免费使用该脚本,但请记住,重新发布代码须遵守我们的网站规则。

免责声明
这些信息和出版物并非旨在提供,也不构成TradingView提供或认可的任何形式的财务、投资、交易或其他类型的建议或推荐。请阅读使用条款了解更多信息。
开源脚本
秉承TradingView的精神,该脚本的作者将其开源,以便交易者可以查看和验证其功能。向作者致敬!您可以免费使用该脚本,但请记住,重新发布代码须遵守我们的网站规则。
免责声明
这些信息和出版物并非旨在提供,也不构成TradingView提供或认可的任何形式的财务、投资、交易或其他类型的建议或推荐。请阅读使用条款了解更多信息。