已更新
Dynamic Oscillator (RSI, MACD, Stoch, Stoch RSI)
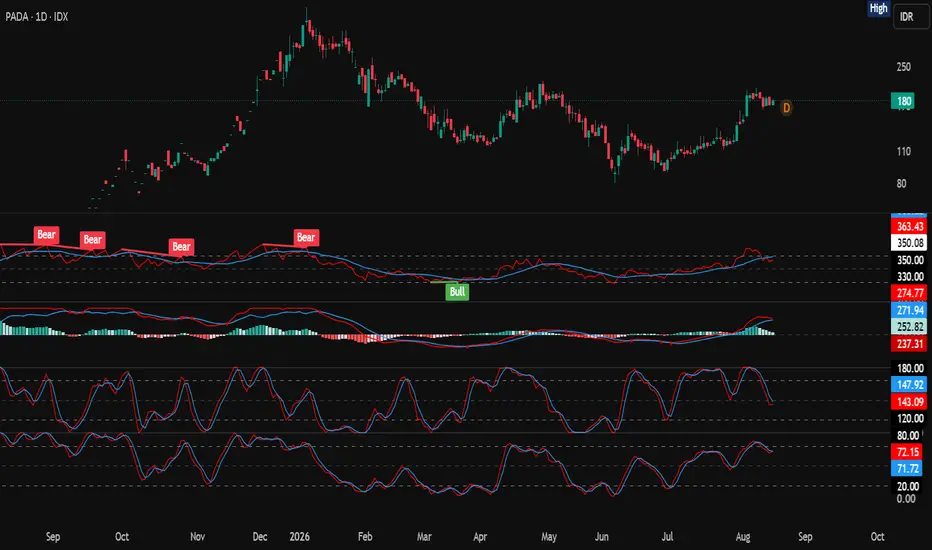
Description:
This indicator combines four of the most widely used momentum and trend oscillators—RSI, MACD, Stochastic RSI, and Stochastic—into a single, unified pane.
Originality and Usefulness:
The primary issue with combining multiple bounded (0-100) and unbounded (MACD) oscillators into a single pane is overlapping, which creates an unreadable chart. This script solves that problem by introducing a Dynamic Auto-Scaling and Stacking Algorithm.
Instead of rendering all indicators on the same axis, the script dynamically assigns a visual 100-point tier (base level) to each activated indicator. If an indicator is toggled off in the settings, the script automatically recalculates the bases and shifts the remaining active indicators down to fill the void (auto-scale). This ensures a clean, non-overlapping visualization that saves valuable chart space, especially for users who rely on multiple momentum confirmations.
To achieve this, the script utilizes invisible base plots and custom helper functions drawing extended dashed lines (line.new with extend.both) to act as smart visual separators that adapt dynamically based on how many indicators are currently active.
Underlying Concepts & How It Does It:
1. MACD Normalization (Unbounded to Bounded):
Since the MACD does not have a fixed upper or lower bound, directly overlaying it with bounded oscillators is impossible without distortion. This script uses a mathematical workaround: it calculates the highest absolute value among the MACD line, Signal line, and Histogram over a 100-bar lookback window using ta.highest(). It then generates a proportional scaling factor to compress the MACD data precisely into a 100-point visual zone. The visual crosses, trend direction, and histogram shapes remain mathematically accurate to a traditional MACD, but scaled to fit the stacking environment.
2. Relative Strength Index (RSI) & Divergence:
The script includes a standard RSI (default 14-period). It is equipped with an automated Regular Divergence detection system. The logic uses ta.pivotlow and ta.pivothigh with customizable lookback windows (left and right) to identify price extremes compared to RSI extremes. Furthermore, users can enable a moving average smoothing line directly applied to the RSI calculation (SMA, EMA, WMA, VWMA, or Bollinger Bands).
3. Stochastic & Stochastic RSI:
The script calculates the traditional Stochastic Oscillator (%K and %D) using the standard ta.stoch() function based on Close, High, and Low. Additionally, it provides the Stochastic RSI, applying the Stochastic formula directly to the RSI values rather than price data, increasing sensitivity for identifying short-term overbought/oversold conditions.
How to Use It:
● Toggle System: Open the indicator settings and use the checkboxes to turn specific oscillators ON or OFF. The layout will adapt automatically.
● Confluence Trading: Use this stacked view to spot confluences. For example, spotting a Regular Bullish Divergence on the RSI occurring simultaneously with a MACD zero-line cross and a Stochastic %K/%D crossover in the oversold zone.
● Clean Visualization: The indicator uses custom transparent boundaries and dashed separator lines to keep your workspace structured.
(Note: This script is published for educational purposes to demonstrate dynamic vertical scaling of mixed-bound arrays).
Disclaimer:
This script is strictly an analytical tool for educational and informational purposes only. It does not constitute financial advice, nor is it an invitation, solicitation, or recommendation to buy or sell any financial instrument. The developer of this indicator assumes no responsibility or liability for any trading decisions, financial losses, or actions you take based on this tool. Trading in financial markets involves a high degree of risk, and all trading decisions are entirely in your own hands. Past performance of any trading system is not indicative of future results. Always Do Your Own Research (DYOR) and test strategies on a paper trading account before risking real capital.
This indicator combines four of the most widely used momentum and trend oscillators—RSI, MACD, Stochastic RSI, and Stochastic—into a single, unified pane.
Originality and Usefulness:
The primary issue with combining multiple bounded (0-100) and unbounded (MACD) oscillators into a single pane is overlapping, which creates an unreadable chart. This script solves that problem by introducing a Dynamic Auto-Scaling and Stacking Algorithm.
Instead of rendering all indicators on the same axis, the script dynamically assigns a visual 100-point tier (base level) to each activated indicator. If an indicator is toggled off in the settings, the script automatically recalculates the bases and shifts the remaining active indicators down to fill the void (auto-scale). This ensures a clean, non-overlapping visualization that saves valuable chart space, especially for users who rely on multiple momentum confirmations.
To achieve this, the script utilizes invisible base plots and custom helper functions drawing extended dashed lines (line.new with extend.both) to act as smart visual separators that adapt dynamically based on how many indicators are currently active.
Underlying Concepts & How It Does It:
1. MACD Normalization (Unbounded to Bounded):
Since the MACD does not have a fixed upper or lower bound, directly overlaying it with bounded oscillators is impossible without distortion. This script uses a mathematical workaround: it calculates the highest absolute value among the MACD line, Signal line, and Histogram over a 100-bar lookback window using ta.highest(). It then generates a proportional scaling factor to compress the MACD data precisely into a 100-point visual zone. The visual crosses, trend direction, and histogram shapes remain mathematically accurate to a traditional MACD, but scaled to fit the stacking environment.
2. Relative Strength Index (RSI) & Divergence:
The script includes a standard RSI (default 14-period). It is equipped with an automated Regular Divergence detection system. The logic uses ta.pivotlow and ta.pivothigh with customizable lookback windows (left and right) to identify price extremes compared to RSI extremes. Furthermore, users can enable a moving average smoothing line directly applied to the RSI calculation (SMA, EMA, WMA, VWMA, or Bollinger Bands).
3. Stochastic & Stochastic RSI:
The script calculates the traditional Stochastic Oscillator (%K and %D) using the standard ta.stoch() function based on Close, High, and Low. Additionally, it provides the Stochastic RSI, applying the Stochastic formula directly to the RSI values rather than price data, increasing sensitivity for identifying short-term overbought/oversold conditions.
How to Use It:
● Toggle System: Open the indicator settings and use the checkboxes to turn specific oscillators ON or OFF. The layout will adapt automatically.
● Confluence Trading: Use this stacked view to spot confluences. For example, spotting a Regular Bullish Divergence on the RSI occurring simultaneously with a MACD zero-line cross and a Stochastic %K/%D crossover in the oversold zone.
● Clean Visualization: The indicator uses custom transparent boundaries and dashed separator lines to keep your workspace structured.
(Note: This script is published for educational purposes to demonstrate dynamic vertical scaling of mixed-bound arrays).
Disclaimer:
This script is strictly an analytical tool for educational and informational purposes only. It does not constitute financial advice, nor is it an invitation, solicitation, or recommendation to buy or sell any financial instrument. The developer of this indicator assumes no responsibility or liability for any trading decisions, financial losses, or actions you take based on this tool. Trading in financial markets involves a high degree of risk, and all trading decisions are entirely in your own hands. Past performance of any trading system is not indicative of future results. Always Do Your Own Research (DYOR) and test strategies on a paper trading account before risking real capital.
版本注释
Release Note: 6-in-1 Expansion (SMI & SMIIO Integration)In this major update, the indicator has been expanded from a 4-in-1 to a 6-in-1 dynamic oscillator system. The core stacking algorithm has been upgraded to accommodate two powerful momentum tools developed by William Blau: the Stochastic Momentum Index (SMI) and the SMI Ergodic Indicator & Oscillator (SMIIO).
What's New in This Update:
● SMI (Stochastic Momentum Index) Integration:
Added the SMI, which measures the close relative to the midpoint of the recent high-low range, double-smoothed by EMAs. This provides a highly sensitive, bounded (0-100 scaled) alternative to the traditional Stochastic for identifying early exhaustion points. It seamlessly integrates into its own dedicated 100-point tier within the auto-scaling algorithm when toggled on.
● SMIIO (SMI Ergodic) with Dynamic Auto-Scaling:
Added the SMI Ergodic Oscillator. Since SMIIO is an unbounded, MACD-like trend-following indicator (calculating the True Strength Index of price change rather than range), it cannot be natively plotted alongside bounded oscillators. I have applied the identical normalization mathematical workaround used for the MACD: calculating the highest absolute value of the Ergodic line, Signal line, and Oscillator over a 100-bar lookback (ta.highest()) to compress the data perfectly into a 100-point visual zone without losing its structural integrity.
● 4-Color MACD-Style Visuals for SMIIO:
The SMIIO histogram now features a dynamic 4-color growth/fall visual system (identical to the MACD histogram) to easily spot momentum acceleration and deceleration.
● Visual Cross Markers:
Added high-visibility white circular plots (style=plot.style_circles) that automatically trigger precisely on the signal line whenever the SMIIO indicator and its signal line cross, providing immediate trend-shift confirmations.
● Upgraded Smart Separators:
The internal f_hline() extension logic has been updated to generate up to 5 invisible dynamic tier separators, adapting on the fly depending on which of the 6 indicators the user chooses to activate.
How to Use the New Features:
Open the indicator settings and check "Show SMI" or "Show SMI Ergodic (SMIIO)". You can combine the SMIIO's trend-following crossover signals with the RSI's divergence detection on a single, non-overlapping pane to find high-probability confluence zones.

免责声明
这些信息和出版物并非旨在提供,也不构成TradingView提供或认可的任何形式的财务、投资、交易或其他类型的建议或推荐。请阅读使用条款了解更多信息。