Reversion Probability Bands [QuantAlgo]
More exclusive indicators from QuantAlgo
Subscribe to QuantAlgo Essential for $49.99/month to get exclusive indicators by this author. You pay right on TradingView and can use them on your charts straight away.
Explore QuantAlgo Essential🟢 Overview
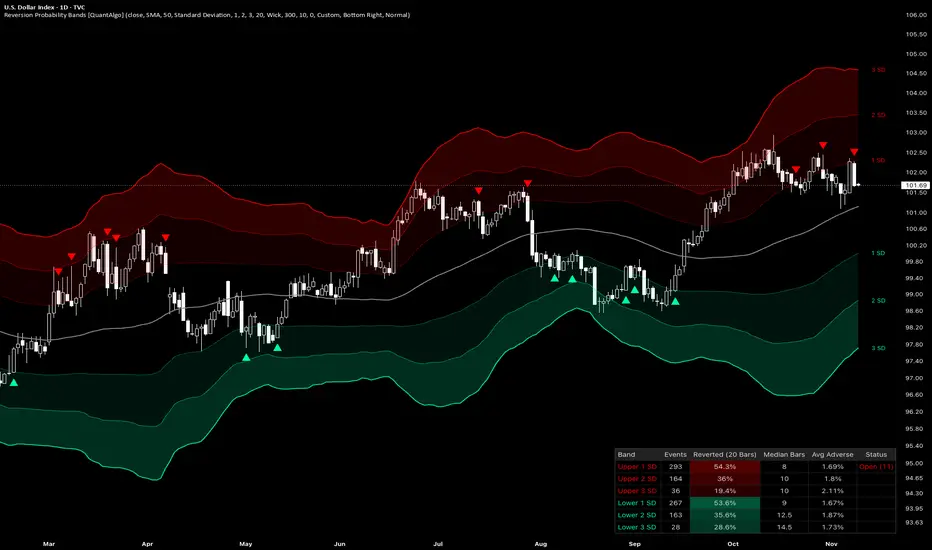
The Reversion Probability Bands is a mean-reversion indicator that places three pairs of volatility bands around a moving average and measures, from the chart’s own history, how often price has returned to that mean after closing beyond each band. Stretches beyond each of the six bands are followed until price reaches the mean or a set number of bars passes, and a dashboard reports each band’s historical reversion rate, the median number of bars a reversion took, and the average adverse move along the way, while re-entry signals mark closes back inside the inner bands. This lets traders judge each band by how price has actually behaved there on a specific symbol and timeframe, rather than assuming that a close beyond a band will revert across every timeframe and market.

🟢 How It Works
Bands around a moving average are often read as a sign that price beyond them is overextended and likely to return to the average, yet how often that has happened varies from one market, timeframe, and band distance to the next. The indicator measures it directly by following each excursion beyond a band and recording how it ends. It has three stages: the bands that define each stretch, an excursion tracker that follows each stretch to its outcome and builds the statistics, and a signal engine that marks re-entries and can hold them back until a band’s record meets a chosen standard.
First, the bands are built. The mean is a simple, exponential, weighted, or volume-weighted moving average of the source, and the band unit is either the standard deviation of the source, always measured around its simple average over the same length, or the Average True Range over that length. Inner, middle, and outer multipliers set three bands on each side, so with an SMA mean and the Standard Deviation basis the bands follow the Bollinger Band construction at three distances, while the ATR basis spaces them by average true range in the manner of Keltner Channels. The volume-weighted mean needs volume data, and on symbols that provide none a warning on the chart explains why the bands are missing:
Pine Script®
Next, excursions are tracked on every closed bar. An excursion begins when a close crosses from inside a band to beyond it, and that close becomes its entry. While it is open, the largest move against the reversion is recorded from how far each bar’s high rises above the entry of an upper band excursion, or its low falls below the entry of a lower band excursion, as a percentage of the entry close. The excursion counts as reverted once price reaches the mean, by the bar’s wick or by its close as set by Mean Touch, and as not reverted once the Reversion Horizon passes without it, with the mean moving all the while so it can also meet price partway. Each band follows one excursion at a time and keeps a rolling sample of its most recent completed excursions, from which the dashboard derives the share that reached the mean, the median time those reversions needed, and the average adverse move across every completed excursion:
Pine Script®
Finally, the signal engine marks re-entries. A bearish setup prints on the closed bar where price closes back at or below the upper inner band after closing above it, and a bullish setup is its mirror image at the lower inner band, while closes that cross beyond the inner bands are flagged as stretches for the alerts. With Min Reversion Rate above zero, a setup also requires the inner band on that side to hold at least the Min Sample Size of completed excursions and a reversion rate at or above that level. Signals, alerts, and statistics update only on closed bars, so a printed setup stays in place once its bar closes, while the bands and their labels follow the forming bar:
Pine Script®

🟢 Signal Interpretation
▶ Reverted (Dashboard): The share of a band’s completed excursions that reached the mean within the Reversion Horizon, out of the count under Events, shaded more strongly as the share rises. A higher figure means closes beyond that band have more often been followed by a return to the mean on that symbol and timeframe, and comparing the upper and lower rows shows whether stretches in one direction have reverted more often than in the other. It is a historical frequency drawn from the bars loaded on the chart, which depend on the symbol’s history, the chart timeframe, and the TradingView plan, rather than the probability that the next excursion or any single signal will revert. Longer horizons and the Wick touch count more excursions as reverted, so the figure is most comparable across bands, symbols, and timeframes measured at the same settings, and a band that has not yet reached the Min Sample Size shows n < followed by that size in its place, with dashes for its other figures.

▶ Median Bars and Avg Adverse (Dashboard): Median Bars is the median number of bars the reverted excursions took to reach the mean, which shows how quickly reversions have unfolded when they occurred and can help frame time-based exits. Avg Adverse is the average of each completed excursion’s deepest push against the reversion, reverted or not, as a percentage of its entry close, which shows how much further price has typically stretched before the excursion resolved and can help size stop distances. Both are measured from the first close beyond the band, so they describe the stretch as a whole rather than the path from a later entry such as a re-entry signal.

▶ Status (Dashboard): A band with an excursion in progress shows its age in bars, such as Open (3). The excursion stays open after price closes back inside the band until it reaches the mean or the Reversion Horizon passes, so comparing its age with the band’s Median Bars shows how far the current stretch has run against that band’s record.

▶ Bearish Reversion Setup (Triangle Above Bar): A triangle above the bar marks the close that brings price back inside the upper inner band after a close above it, reading as buyers losing their grip on a stretch above the mean. Treat this as a potential short setup back toward the mean, weighed against the Reverted, Median Bars, and Avg Adverse figures of the upper inner band, which describe how its past excursions have played out.

▶ Bullish Reversion Setup (Triangle Below Bar): A triangle below the bar appears when a close returns inside the lower inner band after closing below it, as selling pressure fades from a stretch below the mean. Read this as a potential long setup toward the mean, judged by the same three figures for the lower inner band.

🟢 Features
▶ Configurable Measurement: Four mean types (SMA, EMA, WMA, and VWMA), two band width bases (Standard Deviation and ATR), and independent inner, middle, and outer multipliers define what counts as a stretch. The Reversion Horizon and Mean Touch set how each excursion is judged, Max Events per Band sets how many recent excursions each band’s figures draw on, and Min Sample Size sets how many a band needs before its figures are reported.

▶ Built-in Alerts: Five alert conditions support hands-off monitoring. “Upper Band Stretch” and “Lower Band Stretch” fire when a closed bar crosses above the upper inner band or below the lower inner band. “Bearish Reversion Setup” and “Bullish Reversion Setup” fire on the closed bar of each setup, whether or not the triangles are shown, and “Any Reversion Setup” fires on either. Alert messages include exchange, ticker, and timeframe for immediate context, and the Any alert() function call option sends each inner band stretch and setup with that band’s dashboard figures and the level of the mean in the message.

▶ Visual Customization: Six color presets (Classic, Aqua, Cosmic, Cyber, Neon, and Custom) apply coordinated bearish and bullish colors to the upper and lower bands, their zones and labels, the re-entry triangles, and the matching dashboard rows, while the Mean Color sets the mean line under every preset. Zone fills shade the space between the inner and middle bands lightly and between the middle and outer bands more strongly, short labels such as 1 SD, 2 SD, and 3 SD, or the ATR multiples, mark each band at its right end, and the dashboard can sit in any of nine positions with four text sizes. Colors adapt automatically to light and dark chart backgrounds, and the zone fills, band labels, signals, and dashboard can each be toggled, so the chart stays as clean or as detailed as the workflow requires.

The Reversion Probability Bands is a mean-reversion indicator that places three pairs of volatility bands around a moving average and measures, from the chart’s own history, how often price has returned to that mean after closing beyond each band. Stretches beyond each of the six bands are followed until price reaches the mean or a set number of bars passes, and a dashboard reports each band’s historical reversion rate, the median number of bars a reversion took, and the average adverse move along the way, while re-entry signals mark closes back inside the inner bands. This lets traders judge each band by how price has actually behaved there on a specific symbol and timeframe, rather than assuming that a close beyond a band will revert across every timeframe and market.
🟢 How It Works
Bands around a moving average are often read as a sign that price beyond them is overextended and likely to return to the average, yet how often that has happened varies from one market, timeframe, and band distance to the next. The indicator measures it directly by following each excursion beyond a band and recording how it ends. It has three stages: the bands that define each stretch, an excursion tracker that follows each stretch to its outcome and builds the statistics, and a signal engine that marks re-entries and can hold them back until a band’s record meets a chosen standard.
First, the bands are built. The mean is a simple, exponential, weighted, or volume-weighted moving average of the source, and the band unit is either the standard deviation of the source, always measured around its simple average over the same length, or the Average True Range over that length. Inner, middle, and outer multipliers set three bands on each side, so with an SMA mean and the Standard Deviation basis the bands follow the Bollinger Band construction at three distances, while the ATR basis spaces them by average true range in the manner of Keltner Channels. The volume-weighted mean needs volume data, and on symbols that provide none a warning on the chart explains why the bands are missing:
Next, excursions are tracked on every closed bar. An excursion begins when a close crosses from inside a band to beyond it, and that close becomes its entry. While it is open, the largest move against the reversion is recorded from how far each bar’s high rises above the entry of an upper band excursion, or its low falls below the entry of a lower band excursion, as a percentage of the entry close. The excursion counts as reverted once price reaches the mean, by the bar’s wick or by its close as set by Mean Touch, and as not reverted once the Reversion Horizon passes without it, with the mean moving all the while so it can also meet price partway. Each band follows one excursion at a time and keeps a rolling sample of its most recent completed excursions, from which the dashboard derives the share that reached the mean, the median time those reversions needed, and the average adverse move across every completed excursion:
Finally, the signal engine marks re-entries. A bearish setup prints on the closed bar where price closes back at or below the upper inner band after closing above it, and a bullish setup is its mirror image at the lower inner band, while closes that cross beyond the inner bands are flagged as stretches for the alerts. With Min Reversion Rate above zero, a setup also requires the inner band on that side to hold at least the Min Sample Size of completed excursions and a reversion rate at or above that level. Signals, alerts, and statistics update only on closed bars, so a printed setup stays in place once its bar closes, while the bands and their labels follow the forming bar:
🟢 Signal Interpretation
▶ Reverted (Dashboard): The share of a band’s completed excursions that reached the mean within the Reversion Horizon, out of the count under Events, shaded more strongly as the share rises. A higher figure means closes beyond that band have more often been followed by a return to the mean on that symbol and timeframe, and comparing the upper and lower rows shows whether stretches in one direction have reverted more often than in the other. It is a historical frequency drawn from the bars loaded on the chart, which depend on the symbol’s history, the chart timeframe, and the TradingView plan, rather than the probability that the next excursion or any single signal will revert. Longer horizons and the Wick touch count more excursions as reverted, so the figure is most comparable across bands, symbols, and timeframes measured at the same settings, and a band that has not yet reached the Min Sample Size shows n < followed by that size in its place, with dashes for its other figures.
▶ Median Bars and Avg Adverse (Dashboard): Median Bars is the median number of bars the reverted excursions took to reach the mean, which shows how quickly reversions have unfolded when they occurred and can help frame time-based exits. Avg Adverse is the average of each completed excursion’s deepest push against the reversion, reverted or not, as a percentage of its entry close, which shows how much further price has typically stretched before the excursion resolved and can help size stop distances. Both are measured from the first close beyond the band, so they describe the stretch as a whole rather than the path from a later entry such as a re-entry signal.
▶ Status (Dashboard): A band with an excursion in progress shows its age in bars, such as Open (3). The excursion stays open after price closes back inside the band until it reaches the mean or the Reversion Horizon passes, so comparing its age with the band’s Median Bars shows how far the current stretch has run against that band’s record.
▶ Bearish Reversion Setup (Triangle Above Bar): A triangle above the bar marks the close that brings price back inside the upper inner band after a close above it, reading as buyers losing their grip on a stretch above the mean. Treat this as a potential short setup back toward the mean, weighed against the Reverted, Median Bars, and Avg Adverse figures of the upper inner band, which describe how its past excursions have played out.
▶ Bullish Reversion Setup (Triangle Below Bar): A triangle below the bar appears when a close returns inside the lower inner band after closing below it, as selling pressure fades from a stretch below the mean. Read this as a potential long setup toward the mean, judged by the same three figures for the lower inner band.
🟢 Features
▶ Configurable Measurement: Four mean types (SMA, EMA, WMA, and VWMA), two band width bases (Standard Deviation and ATR), and independent inner, middle, and outer multipliers define what counts as a stretch. The Reversion Horizon and Mean Touch set how each excursion is judged, Max Events per Band sets how many recent excursions each band’s figures draw on, and Min Sample Size sets how many a band needs before its figures are reported.
▶ Built-in Alerts: Five alert conditions support hands-off monitoring. “Upper Band Stretch” and “Lower Band Stretch” fire when a closed bar crosses above the upper inner band or below the lower inner band. “Bearish Reversion Setup” and “Bullish Reversion Setup” fire on the closed bar of each setup, whether or not the triangles are shown, and “Any Reversion Setup” fires on either. Alert messages include exchange, ticker, and timeframe for immediate context, and the Any alert() function call option sends each inner band stretch and setup with that band’s dashboard figures and the level of the mean in the message.
▶ Visual Customization: Six color presets (Classic, Aqua, Cosmic, Cyber, Neon, and Custom) apply coordinated bearish and bullish colors to the upper and lower bands, their zones and labels, the re-entry triangles, and the matching dashboard rows, while the Mean Color sets the mean line under every preset. Zone fills shade the space between the inner and middle bands lightly and between the middle and outer bands more strongly, short labels such as 1 SD, 2 SD, and 3 SD, or the ATR multiples, mark each band at its right end, and the dashboard can sit in any of nine positions with four text sizes. Colors adapt automatically to light and dark chart backgrounds, and the zone fills, band labels, signals, and dashboard can each be toggled, so the chart stays as clean or as detailed as the workflow requires.

🟢 Access our best trading & investing tools: joinquantalgo.com/plans
🟢 Free Special Edition indicators: joinquantalgo.com/special-editions
🟢 Discord: discord.gg/hJaFyGEAyX
🟢 Free Special Edition indicators: joinquantalgo.com/special-editions
🟢 Discord: discord.gg/hJaFyGEAyX
免责声明
这些信息和出版物并非旨在提供,也不构成TradingView提供或认可的任何形式的财务、投资、交易或其他类型的建议或推荐。请阅读使用条款了解更多信息。
🟢 Access our best trading & investing tools: joinquantalgo.com/plans
🟢 Free Special Edition indicators: joinquantalgo.com/special-editions
🟢 Discord: discord.gg/hJaFyGEAyX
🟢 Free Special Edition indicators: joinquantalgo.com/special-editions
🟢 Discord: discord.gg/hJaFyGEAyX
免责声明
这些信息和出版物并非旨在提供,也不构成TradingView提供或认可的任何形式的财务、投资、交易或其他类型的建议或推荐。请阅读使用条款了解更多信息。