OPEN-SOURCE SCRIPT
已更新 Divergence Strength Analyzer-John Hayden
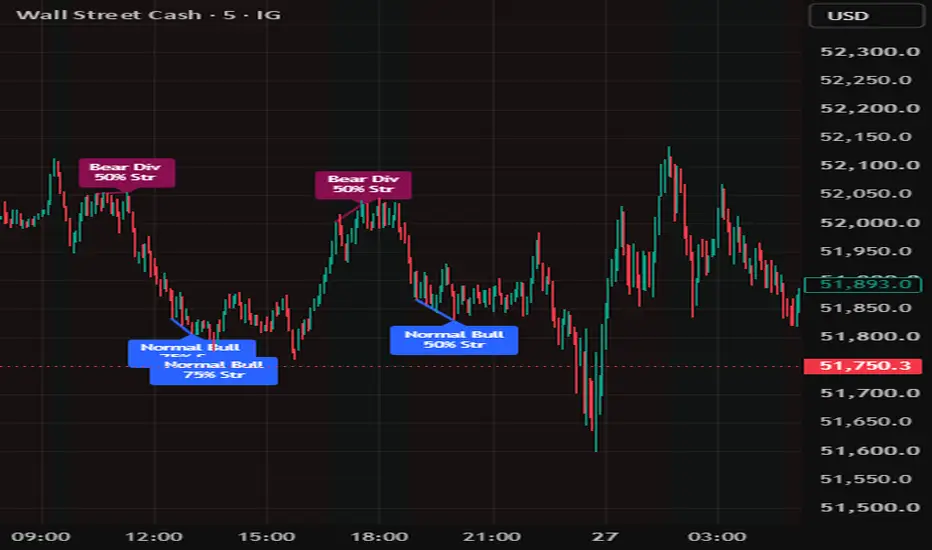
Hayden Momentum Regimes & Time-Decay Divergence Analyzer
Overview:
Most retail traders treat the Relative Strength Index (RSI) as a basic overbought/oversold oscillator—shorting above 70 and buying below 30. In *"RSI: The Complete Guide," John Hayden* completely flips this flawed conventional wisdom on its head. Hayden demonstrates that extreme RSI levels actually represent high-velocity structural momentum expansions rather than impending reversals.
This open-source Pine Script tool here maps Hayden's proprietary market regimes, isolates institutional *Hidden and Normal Divergences, and introduces a strict **Time-Decay Strength Matrix* to filter out low-velocity market noise.
Core Mechanics
1. The High-Velocity Regime Speedometer
Instead of looking for immediate trend reversals when the RSI enters extreme territories, this indicator uses these levels to categorize the macro trend structure:
*The Bull Market Regime (40/80 Range):* Initiated when the RSI breaks out above 70. Once confirmed, the RSI establishes a firm support floor around the *40* line during pullbacks, indicating heavy institutional backing.
*The Bear Market Regime (20/60 Range):* Initiated when the RSI drops below 30. Relief rallies consistently stall out and find a ceiling around the *60* line, proving persistent distribution.
2. The Power of Hayden's Hidden Divergence
While normal divergence frequently acts as a near-term counter-trend trap, Hayden highlights *Hidden Divergence* as the ultimate trend-continuation footprint.
* In a confirmed bullish regime, the price prints a structurally higher low while the RSI registers a deeply oversold lower low. This discrepancy indicates that while emotional momentum has fully cooled off, structural buying pressure remains completely intact, creating a coiled spring ready to unleash the next "superfast" leg up.
3. The Time-Decay Strength Matrix (%)
A primary reason traders fail with standard divergence indicators is that they fail to account for the element of time. Hayden explicitly teaches that the validity of a momentum discrepancy decays the longer it takes to form.
This script mathematically calculates the precise distance between structural peaks or troughs and scores the setup using Hayden’s time-based parameters:
* 🚀 *100% Strength (Ultra Condensed):* \le 4 bars between pivots. Highly explosive immediate velocity.
* 📈 *75% Strength (Standard Strong):* 5 to 8 bars between pivots. Highly reliable trend-joiner.
* ⚖️ *50% Strength (Moderate):* 9 to 12 bars between pivots. Average momentum reliability.
* ❌ *0% Strength (Decayed/Filtered):* > 16 bars between pivots. The setup is completely ignored and filtered off your chart to prevent slow, sideways chops.
How to Trade This Script
1. *Scan the Regime Background:* Look for a faint green chart overlay to confirm you are inside a valid Hayden Bull Regime.
2. *Locate the Footprint:* Wait for the indicator to map an *MDRP Hidden Bull* or *Normal Bull* label.
3. *Verify the Strength %:* Prioritize signals showcasing *75% to 100% Strength*. This ensures you are striking right at the inflection point of structural trend acceleration.
4. *Invalidation:* If the macro RSI breaks out of its trend bounds (e.g., dropping below the 40-floor buffer in a bull market), the regime shifts to neutral, and current long-bias expectations are discarded.
Features
*Pure Price & Momentum Geometry:* Zero volume filters are utilized, making this script ideal for clean execution across both highly liquid indexes and choppy small-cap resource scripts.
*Dynamic Chart Labels:* Eliminates chart confusion by printing the exact divergence type alongside its dynamic strength rating directly on the key pivot bar.
Overview:
Most retail traders treat the Relative Strength Index (RSI) as a basic overbought/oversold oscillator—shorting above 70 and buying below 30. In *"RSI: The Complete Guide," John Hayden* completely flips this flawed conventional wisdom on its head. Hayden demonstrates that extreme RSI levels actually represent high-velocity structural momentum expansions rather than impending reversals.
This open-source Pine Script tool here maps Hayden's proprietary market regimes, isolates institutional *Hidden and Normal Divergences, and introduces a strict **Time-Decay Strength Matrix* to filter out low-velocity market noise.
Core Mechanics
1. The High-Velocity Regime Speedometer
Instead of looking for immediate trend reversals when the RSI enters extreme territories, this indicator uses these levels to categorize the macro trend structure:
*The Bull Market Regime (40/80 Range):* Initiated when the RSI breaks out above 70. Once confirmed, the RSI establishes a firm support floor around the *40* line during pullbacks, indicating heavy institutional backing.
*The Bear Market Regime (20/60 Range):* Initiated when the RSI drops below 30. Relief rallies consistently stall out and find a ceiling around the *60* line, proving persistent distribution.
2. The Power of Hayden's Hidden Divergence
While normal divergence frequently acts as a near-term counter-trend trap, Hayden highlights *Hidden Divergence* as the ultimate trend-continuation footprint.
* In a confirmed bullish regime, the price prints a structurally higher low while the RSI registers a deeply oversold lower low. This discrepancy indicates that while emotional momentum has fully cooled off, structural buying pressure remains completely intact, creating a coiled spring ready to unleash the next "superfast" leg up.
3. The Time-Decay Strength Matrix (%)
A primary reason traders fail with standard divergence indicators is that they fail to account for the element of time. Hayden explicitly teaches that the validity of a momentum discrepancy decays the longer it takes to form.
This script mathematically calculates the precise distance between structural peaks or troughs and scores the setup using Hayden’s time-based parameters:
* 🚀 *100% Strength (Ultra Condensed):* \le 4 bars between pivots. Highly explosive immediate velocity.
* 📈 *75% Strength (Standard Strong):* 5 to 8 bars between pivots. Highly reliable trend-joiner.
* ⚖️ *50% Strength (Moderate):* 9 to 12 bars between pivots. Average momentum reliability.
* ❌ *0% Strength (Decayed/Filtered):* > 16 bars between pivots. The setup is completely ignored and filtered off your chart to prevent slow, sideways chops.
How to Trade This Script
1. *Scan the Regime Background:* Look for a faint green chart overlay to confirm you are inside a valid Hayden Bull Regime.
2. *Locate the Footprint:* Wait for the indicator to map an *MDRP Hidden Bull* or *Normal Bull* label.
3. *Verify the Strength %:* Prioritize signals showcasing *75% to 100% Strength*. This ensures you are striking right at the inflection point of structural trend acceleration.
4. *Invalidation:* If the macro RSI breaks out of its trend bounds (e.g., dropping below the 40-floor buffer in a bull market), the regime shifts to neutral, and current long-bias expectations are discarded.
Features
*Pure Price & Momentum Geometry:* Zero volume filters are utilized, making this script ideal for clean execution across both highly liquid indexes and choppy small-cap resource scripts.
*Dynamic Chart Labels:* Eliminates chart confusion by printing the exact divergence type alongside its dynamic strength rating directly on the key pivot bar.
版本注释
Added Visual trend line to show Divergence版本注释
Visual refresh版本注释
Visual Refresh版本注释
Visual Refresh版本注释
Visual Refresh版本注释
Visual line 开源脚本
秉承TradingView的精神,该脚本的作者将其开源,以便交易者可以查看和验证其功能。向作者致敬!您可以免费使用该脚本,但请记住,重新发布代码须遵守我们的网站规则。

免责声明
这些信息和出版物并非旨在提供,也不构成TradingView提供或认可的任何形式的财务、投资、交易或其他类型的建议或推荐。请阅读使用条款了解更多信息。
免责声明
这些信息和出版物并非旨在提供,也不构成TradingView提供或认可的任何形式的财务、投资、交易或其他类型的建议或推荐。请阅读使用条款了解更多信息。