The Tether [TheSimplifier7]
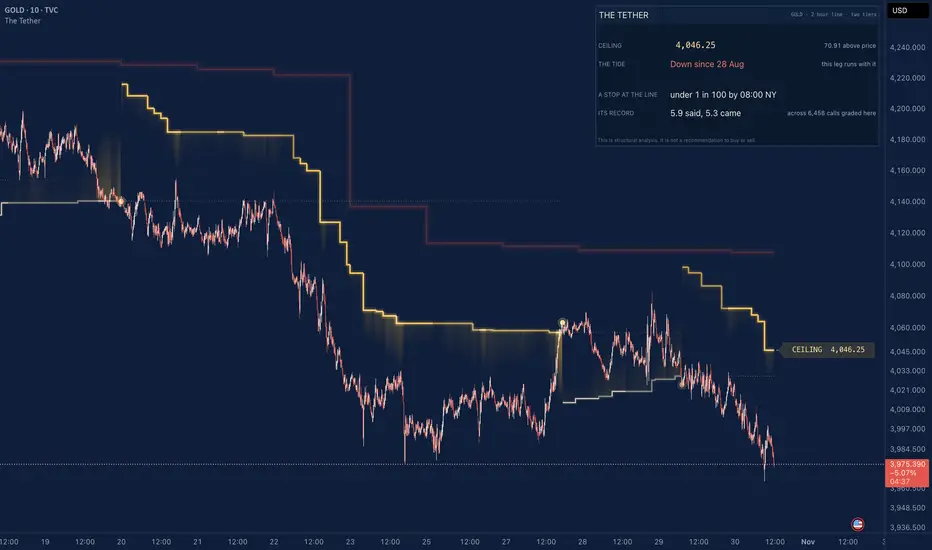
THE TETHER
Ten years on an institutional gold desk taught me that one question matters before every trade: where am I wrong?
Where price goes next comes second. First comes the level where this move is proven wrong, and how close price is to it right now.
The Tether draws that level as one line. It shows you the odds that a stop sitting on that line gets touched before the current 2 hour bar closes. And it grades those odds on your own chart, every time a block closes, in plain sight. If the odds are off, you will see it in the panel before anyone has to tell you.
IN ONE MINUTE
The line under price is a floor. The line over price is a ceiling. A 2 hour close through it turns it.
Gold line: this leg runs with the bigger move. Pale, fine line: this leg runs against it.
A gold knot marks every turn. The level that broke stays on the chart, dotted, until the next turn.
The soft band behind everything is the tide, the same rule run on daily closes: blue when the bigger move runs up, red when it runs down.
The panel tells you where the line is, how far away it is, the odds a stop on it is touched before this 2 hour block closes, and how those odds have done on this chart.
WHY I BUILT IT
Most trailing stops treat every hour the same. Supertrend and its cousins use one ATR multiple at 3am New York and at the US open alike. Anyone who has traded gold through the London fix or the New York open knows those are different markets. A stop that is wide enough at the open is loose in the Asian afternoon, and a stop that is tight enough for the Asian afternoon gets taken out at the open for no reason at all.
The Tether takes its room from the market's own past days at this time of day, each day measured in its own ATR. It gives room where the hour needs it and sits close where the hour is quiet. It only ever steps toward price. It only moves on a 2 hour close. Once a close is in, the line it set does not change.
WHAT YOU SEE ON THE CHART
The line. Under price it is a floor, over price a ceiling. It hangs from the furthest 2 hour close the move has made since the line last turned. It moves only when a 2 hour bar closes, and only toward price. A 2 hour close through it turns it, and a new line starts on the other side.
The knot. A gold knot marks every turn. The level the old line stood at when the close went through it stays on the chart, dotted, across the new leg, until the next turn. Broken levels matter, so you should be able to see where they are.
The tide. The same rule run on daily closes, 1.53 ATR from the furthest daily close, drawn as a soft band behind everything. Blue when the bigger move runs up, red when it runs down. When the leg you are in runs with the tide, the line is gold and three pixels wide. When it runs against the tide, the line is pale and fine. You always know which side of the bigger move you are trading.
The light. A narrow glow on the price side of the line that deepens and warms as price comes back from its furthest close toward the line. It shows distance and nothing else. It is not odds.
The ranging day. When the last day's 2 hour closes travelled at least four times as far as they actually got, that day was going nowhere. The line and its light dim, and the panel says so. It describes the day. It moves nothing.
The rungs. Off by default. Five short marks that divide the room between the line and the furthest close into six. They carry no odds, and the testing section below says why.
THE PANEL, ROW BY ROW
THE FLOOR or THE CEILING: where the line sits and how far it is from price, or the time price touched it.
THE TIDE: which way the bigger move runs, since when, and whether the leg you are in runs with it or against it.
A STOP AT THE LINE: the odds that a stop sitting exactly on the line is touched before this 2 hour block closes, and the time that block closes. "35 in 100 by 22:00" means that on earlier days at this time of day, with the line this far from price in that day's ATR, a stop there was touched before the close about 35 times in 100, after the correction described below.
ITS RECORD: what the odds said on average, against how often the stop was actually touched, across every call graded on your chart. This row is the reason the panel exists. If the odds drift away from what comes, you see it here first.
THE LAST DAY: shows "Ranging" when the line is dimmed.
The last line of the panel: "This is structural analysis. It is not a recommendation to buy or sell." It stays there because it is true.
A LIVE READ
My gold 10 minute chart, 28 October 2026, 21:16 New York:
The floor at 4,028.02, 27.11 under price.
The tide down since 28 August, and this leg running against it.
A stop at the floor: 35 in 100 it is touched by the 22:00 New York close.
Its record on that chart: across 6,483 calls graded, the odds said 6.1 in 100 on average and the stop was touched 5.5 times in 100.
So, an up leg inside a down tide, the floor 27 points away, and about one chance in three that a stop on it gets tagged before the next 2 hour close. That is the whole point of the panel. You know where you are wrong, how far away it is, and how often a stop there has been hit at this hour.
HOW I USE IT
I never use it to get in. I use it to know where I am wrong before I am in, and whether my stop is sitting in the traffic. If the panel says 35 in 100 before the close, my stop is in the traffic. Then I size for that, or I wait for the close. A pale line tells me I am trading against the bigger move, and I trade it that way: smaller, and quicker to let go. When a 2 hour close turns the line, the trade I was in is over. I do not argue with it.
HOW THE LINE IS SET
The line is built from 30 minute bars, so on every chart of 2 hours or less it is the same 2 hour line. It hangs from the furthest 2 hour close since it last turned.
At each 2 hour close it looks back at earlier days at this same time of day and asks one thing. How far was a stop from that day's close pushed within the following gold day, measured in that day's ATR? The room is the distance reached on 20 in 100 of those days (Normal). Close uses 30 in 100, Wide uses 10 in 100. The line moves to that distance only if the move brings it closer to price. It never steps back.
Two tiers, where they were proven. On metals and FX, a leg that runs with the tide gets the wide room (10 in 100), and a leg against it gets the close room (30 in 100), so a counter move is let go sooner. On crypto, indices and oil every leg gets the same room, because there one room did better in the test.
It needs 60 earlier days at a time of day before it counts. Until then it sits a fixed 0.45 ATR from the furthest close. Above the 2 hour chart it runs on the chart's own closes at a fixed distance scaled to the bar: 0.45 ATR times the square root of the bar's trading hours over 2, which is 1.53 ATR on the daily. No odds are counted above 2 hours.
THE ODDS AND THE RECORD
The odds are a count, not a model. On the earlier days at this time of day, what share saw a stop at the line's distance touched before this 2 hour block closed, each day in its own ATR? They are counted again at every 30 minute close.
Then they are corrected by your chart's own graded calls, band by band. If calls around 30 in 100 have been coming true 33 times in 100 on your chart, the next one in that band is nudged up to match. Every call is graded when its block closes, and the panel keeps the score.
They print on charts of 2 hours or less, on the markets where they passed the test: metals, crypto, FX, indices and oil. Anywhere else the panel says so, and the line still works.
HOW IT WAS TESTED
I wrote the rule down before reading the data, then ran it once per market on 30 minute bars from 1 July to 27 October 2026: gold, BTCUSD, EURUSD, NAS100, SPX500 and oil (XTIUSD).
The line never stepped away from price within a leg, on any of the six.
Nothing repainted: the line on the first bars was identical when 500 more bars were added.
It turned back and forth less often than a fixed ATR line on four of the five markets beyond gold.
The odds: in every band of 200 calls or more, what they said stayed within 5 in 100 of what came, on all six markets. Calls graded: gold 3,806, BTCUSD 5,593, EURUSD 3,963, NAS100 3,805, SPX500 3,809, oil 3,809. On silver's 6 minute bars the odds held across 40,034 calls (24 October 2026).
The two tiers did better than one room on gold and EURUSD, and worse on BTCUSD, NAS100, SPX500 and oil. That is why they only run on metals and FX.
The script is the rule that was tested. On gold, the line and the tide it plots matched the tested rule on every one of 9,393 bars.
WHAT FAILED, AND WHAT IT IS NOT
The rungs failed. Odds for five rungs between the line and the furthest close missed by more than 5 in 100 on gold and BTCUSD. So the rungs are off by default and carry no odds.
It calls no side and it is not a trading system. Followed turn to turn on every leg, exactly as it ships, it lost on four of the six markets tested. That is not what it is for.
A turn only comes after a 2 hour close through the line, so it gives back part of the move. On gold from July to October 2026, the median give back was about one ATR, around 72 points, from the furthest close. That is the price of waiting for proof.
It tells you where you are wrong. What you do about it is your trade.
ALERTS
Create one alert on the script and choose "Any alert() function call". It covers three events:
A 2 hour close turns the line.
Price touches the line.
Where the odds print, the odds a stop at the line is touched before the block closes rise to your level (25 in 100 by default).
SETTINGS, ONE BY ONE
THE LINE
The line's distance: a day's room from the clock (default), or a fixed ATR distance at every hour.
Room: Close (30 in 100), Normal (20 in 100, default) or Wide (10 in 100). Used when the tide is off.
Fixed distance, in ATR: 0.45 by default. Used when set to fixed, above 2 hours, and while a time of day still has fewer than 60 earlier days.
The tide: on by default.
Two tiers: Where proven (default), Always or Never.
Clock: New York (default), London or Madrid. This only changes how times are written. The day is always gold's, 18:00 to 17:00 New York.
LOOK
Line width (3), draw the tide, the light, the broken line, dim on a ranging day, rungs (off), turns marked with words (0, every turn keeps its knot either way), and where the panel sits.
ODDS
Show the odds (on), the alert level (25 in 100), and how many 30 minute bars of history the counts are read from (10,000, about 217 days).
QUESTIONS PEOPLE ASK
Does it repaint? No. The line only moves on a closed 2 hour bar, and a closed bar never changes. The odds row updates at each 30 minute close inside the block, which is the point of it.
Why does the line not move while the bar is open? Because a line that follows every tick is a line that gets you out on noise. The Tether waits for a 2 hour close, the same way I wait for one.
Why 2 hours? Two hour blocks are the clock the whole toolkit is built and tested on. Shorter charts see the same 2 hour line, so a 2 minute chart and a 30 minute chart agree.
Why is there no odds row on my chart? Either the chart is above 2 hours, the market is outside the families it was tested on (metals, crypto, FX, indices, oil), or that time of day does not yet have 60 earlier days in your chart's history. On a market outside those families the panel says so.
Why is my line a few tenths of a point away from yours? The counts start where your chart's history starts. Two charts loaded with different history can sit a few tenths of a point apart.
Can I use it on stocks? The line runs anywhere. The odds only print on the families where they passed.
Is it a buy or sell signal? No. It is where you are wrong, priced.
NOTES
The day is gold's, 18:00 to 17:00 New York, on every market.
The odds are counts from past days on this chart, not a promise about the next one.
Open source. Read the code, check the rule, and tell me where you think it is wrong.
Levels named before the move, graded after.
This is structural analysis. It is not a recommendation to buy or sell.
Ten years on an institutional gold desk taught me that one question matters before every trade: where am I wrong?
Where price goes next comes second. First comes the level where this move is proven wrong, and how close price is to it right now.
The Tether draws that level as one line. It shows you the odds that a stop sitting on that line gets touched before the current 2 hour bar closes. And it grades those odds on your own chart, every time a block closes, in plain sight. If the odds are off, you will see it in the panel before anyone has to tell you.
IN ONE MINUTE
The line under price is a floor. The line over price is a ceiling. A 2 hour close through it turns it.
Gold line: this leg runs with the bigger move. Pale, fine line: this leg runs against it.
A gold knot marks every turn. The level that broke stays on the chart, dotted, until the next turn.
The soft band behind everything is the tide, the same rule run on daily closes: blue when the bigger move runs up, red when it runs down.
The panel tells you where the line is, how far away it is, the odds a stop on it is touched before this 2 hour block closes, and how those odds have done on this chart.
WHY I BUILT IT
Most trailing stops treat every hour the same. Supertrend and its cousins use one ATR multiple at 3am New York and at the US open alike. Anyone who has traded gold through the London fix or the New York open knows those are different markets. A stop that is wide enough at the open is loose in the Asian afternoon, and a stop that is tight enough for the Asian afternoon gets taken out at the open for no reason at all.
The Tether takes its room from the market's own past days at this time of day, each day measured in its own ATR. It gives room where the hour needs it and sits close where the hour is quiet. It only ever steps toward price. It only moves on a 2 hour close. Once a close is in, the line it set does not change.
WHAT YOU SEE ON THE CHART
The line. Under price it is a floor, over price a ceiling. It hangs from the furthest 2 hour close the move has made since the line last turned. It moves only when a 2 hour bar closes, and only toward price. A 2 hour close through it turns it, and a new line starts on the other side.
The knot. A gold knot marks every turn. The level the old line stood at when the close went through it stays on the chart, dotted, across the new leg, until the next turn. Broken levels matter, so you should be able to see where they are.
The tide. The same rule run on daily closes, 1.53 ATR from the furthest daily close, drawn as a soft band behind everything. Blue when the bigger move runs up, red when it runs down. When the leg you are in runs with the tide, the line is gold and three pixels wide. When it runs against the tide, the line is pale and fine. You always know which side of the bigger move you are trading.
The light. A narrow glow on the price side of the line that deepens and warms as price comes back from its furthest close toward the line. It shows distance and nothing else. It is not odds.
The ranging day. When the last day's 2 hour closes travelled at least four times as far as they actually got, that day was going nowhere. The line and its light dim, and the panel says so. It describes the day. It moves nothing.
The rungs. Off by default. Five short marks that divide the room between the line and the furthest close into six. They carry no odds, and the testing section below says why.
THE PANEL, ROW BY ROW
THE FLOOR or THE CEILING: where the line sits and how far it is from price, or the time price touched it.
THE TIDE: which way the bigger move runs, since when, and whether the leg you are in runs with it or against it.
A STOP AT THE LINE: the odds that a stop sitting exactly on the line is touched before this 2 hour block closes, and the time that block closes. "35 in 100 by 22:00" means that on earlier days at this time of day, with the line this far from price in that day's ATR, a stop there was touched before the close about 35 times in 100, after the correction described below.
ITS RECORD: what the odds said on average, against how often the stop was actually touched, across every call graded on your chart. This row is the reason the panel exists. If the odds drift away from what comes, you see it here first.
THE LAST DAY: shows "Ranging" when the line is dimmed.
The last line of the panel: "This is structural analysis. It is not a recommendation to buy or sell." It stays there because it is true.
A LIVE READ
My gold 10 minute chart, 28 October 2026, 21:16 New York:
The floor at 4,028.02, 27.11 under price.
The tide down since 28 August, and this leg running against it.
A stop at the floor: 35 in 100 it is touched by the 22:00 New York close.
Its record on that chart: across 6,483 calls graded, the odds said 6.1 in 100 on average and the stop was touched 5.5 times in 100.
So, an up leg inside a down tide, the floor 27 points away, and about one chance in three that a stop on it gets tagged before the next 2 hour close. That is the whole point of the panel. You know where you are wrong, how far away it is, and how often a stop there has been hit at this hour.
HOW I USE IT
I never use it to get in. I use it to know where I am wrong before I am in, and whether my stop is sitting in the traffic. If the panel says 35 in 100 before the close, my stop is in the traffic. Then I size for that, or I wait for the close. A pale line tells me I am trading against the bigger move, and I trade it that way: smaller, and quicker to let go. When a 2 hour close turns the line, the trade I was in is over. I do not argue with it.
HOW THE LINE IS SET
The line is built from 30 minute bars, so on every chart of 2 hours or less it is the same 2 hour line. It hangs from the furthest 2 hour close since it last turned.
At each 2 hour close it looks back at earlier days at this same time of day and asks one thing. How far was a stop from that day's close pushed within the following gold day, measured in that day's ATR? The room is the distance reached on 20 in 100 of those days (Normal). Close uses 30 in 100, Wide uses 10 in 100. The line moves to that distance only if the move brings it closer to price. It never steps back.
Two tiers, where they were proven. On metals and FX, a leg that runs with the tide gets the wide room (10 in 100), and a leg against it gets the close room (30 in 100), so a counter move is let go sooner. On crypto, indices and oil every leg gets the same room, because there one room did better in the test.
It needs 60 earlier days at a time of day before it counts. Until then it sits a fixed 0.45 ATR from the furthest close. Above the 2 hour chart it runs on the chart's own closes at a fixed distance scaled to the bar: 0.45 ATR times the square root of the bar's trading hours over 2, which is 1.53 ATR on the daily. No odds are counted above 2 hours.
THE ODDS AND THE RECORD
The odds are a count, not a model. On the earlier days at this time of day, what share saw a stop at the line's distance touched before this 2 hour block closed, each day in its own ATR? They are counted again at every 30 minute close.
Then they are corrected by your chart's own graded calls, band by band. If calls around 30 in 100 have been coming true 33 times in 100 on your chart, the next one in that band is nudged up to match. Every call is graded when its block closes, and the panel keeps the score.
They print on charts of 2 hours or less, on the markets where they passed the test: metals, crypto, FX, indices and oil. Anywhere else the panel says so, and the line still works.
HOW IT WAS TESTED
I wrote the rule down before reading the data, then ran it once per market on 30 minute bars from 1 July to 27 October 2026: gold, BTCUSD, EURUSD, NAS100, SPX500 and oil (XTIUSD).
The line never stepped away from price within a leg, on any of the six.
Nothing repainted: the line on the first bars was identical when 500 more bars were added.
It turned back and forth less often than a fixed ATR line on four of the five markets beyond gold.
The odds: in every band of 200 calls or more, what they said stayed within 5 in 100 of what came, on all six markets. Calls graded: gold 3,806, BTCUSD 5,593, EURUSD 3,963, NAS100 3,805, SPX500 3,809, oil 3,809. On silver's 6 minute bars the odds held across 40,034 calls (24 October 2026).
The two tiers did better than one room on gold and EURUSD, and worse on BTCUSD, NAS100, SPX500 and oil. That is why they only run on metals and FX.
The script is the rule that was tested. On gold, the line and the tide it plots matched the tested rule on every one of 9,393 bars.
WHAT FAILED, AND WHAT IT IS NOT
The rungs failed. Odds for five rungs between the line and the furthest close missed by more than 5 in 100 on gold and BTCUSD. So the rungs are off by default and carry no odds.
It calls no side and it is not a trading system. Followed turn to turn on every leg, exactly as it ships, it lost on four of the six markets tested. That is not what it is for.
A turn only comes after a 2 hour close through the line, so it gives back part of the move. On gold from July to October 2026, the median give back was about one ATR, around 72 points, from the furthest close. That is the price of waiting for proof.
It tells you where you are wrong. What you do about it is your trade.
ALERTS
Create one alert on the script and choose "Any alert() function call". It covers three events:
A 2 hour close turns the line.
Price touches the line.
Where the odds print, the odds a stop at the line is touched before the block closes rise to your level (25 in 100 by default).
SETTINGS, ONE BY ONE
THE LINE
The line's distance: a day's room from the clock (default), or a fixed ATR distance at every hour.
Room: Close (30 in 100), Normal (20 in 100, default) or Wide (10 in 100). Used when the tide is off.
Fixed distance, in ATR: 0.45 by default. Used when set to fixed, above 2 hours, and while a time of day still has fewer than 60 earlier days.
The tide: on by default.
Two tiers: Where proven (default), Always or Never.
Clock: New York (default), London or Madrid. This only changes how times are written. The day is always gold's, 18:00 to 17:00 New York.
LOOK
Line width (3), draw the tide, the light, the broken line, dim on a ranging day, rungs (off), turns marked with words (0, every turn keeps its knot either way), and where the panel sits.
ODDS
Show the odds (on), the alert level (25 in 100), and how many 30 minute bars of history the counts are read from (10,000, about 217 days).
QUESTIONS PEOPLE ASK
Does it repaint? No. The line only moves on a closed 2 hour bar, and a closed bar never changes. The odds row updates at each 30 minute close inside the block, which is the point of it.
Why does the line not move while the bar is open? Because a line that follows every tick is a line that gets you out on noise. The Tether waits for a 2 hour close, the same way I wait for one.
Why 2 hours? Two hour blocks are the clock the whole toolkit is built and tested on. Shorter charts see the same 2 hour line, so a 2 minute chart and a 30 minute chart agree.
Why is there no odds row on my chart? Either the chart is above 2 hours, the market is outside the families it was tested on (metals, crypto, FX, indices, oil), or that time of day does not yet have 60 earlier days in your chart's history. On a market outside those families the panel says so.
Why is my line a few tenths of a point away from yours? The counts start where your chart's history starts. Two charts loaded with different history can sit a few tenths of a point apart.
Can I use it on stocks? The line runs anywhere. The odds only print on the families where they passed.
Is it a buy or sell signal? No. It is where you are wrong, priced.
NOTES
The day is gold's, 18:00 to 17:00 New York, on every market.
The odds are counts from past days on this chart, not a promise about the next one.
Open source. Read the code, check the rule, and tell me where you think it is wrong.
Levels named before the move, graded after.
This is structural analysis. It is not a recommendation to buy or sell.

The Fan: 7 days free, then €149.99/month. Cancel before day 7 and pay nothing.
Start the trial: thesimplifier7.com/method.html
The record, every miss kept: thesimplifier7.com
Questions: DM @TheSimplifier7 on X
Start the trial: thesimplifier7.com/method.html
The record, every miss kept: thesimplifier7.com
Questions: DM @TheSimplifier7 on X
免责声明
这些信息和出版物并非旨在提供,也不构成TradingView提供或认可的任何形式的财务、投资、交易或其他类型的建议或推荐。请阅读使用条款了解更多信息。
The Fan: 7 days free, then €149.99/month. Cancel before day 7 and pay nothing.
Start the trial: thesimplifier7.com/method.html
The record, every miss kept: thesimplifier7.com
Questions: DM @TheSimplifier7 on X
Start the trial: thesimplifier7.com/method.html
The record, every miss kept: thesimplifier7.com
Questions: DM @TheSimplifier7 on X
免责声明
这些信息和出版物并非旨在提供,也不构成TradingView提供或认可的任何形式的财务、投资、交易或其他类型的建议或推荐。请阅读使用条款了解更多信息。