OPEN-SOURCE SCRIPT
Options X-Level Lock Tracker (Weekly Fri PM)
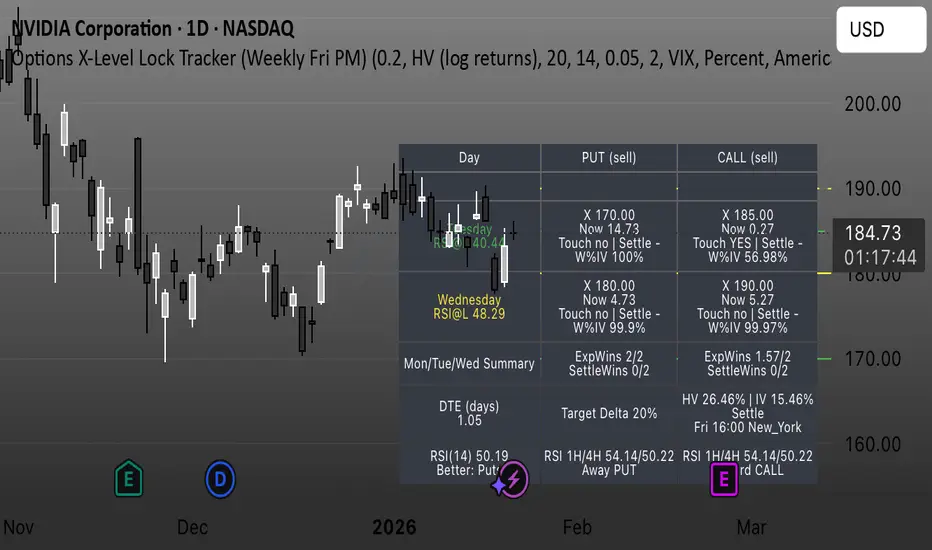
What this indicator is
Options X Lock Tracker is a weekly trade‑management dashboard for defined‑risk premium selling where the “trade thesis” is primarily about finishing on the correct side of a single level (X) by expiration. In this framework, X is the short strike (the “line”) you sell, and the goal is to remain on the correct side of X through settlement.
This script helps you:
Compute candidate PUT X and/or CALL X levels using a volatility‑based model,
Lock those X levels on specific weekdays (Mon/Tue/Wed),
Track touches/breaches during the week, and
Evaluate win/loss at weekly settlement.
Core features
1) X‑Level computation (PUT and/or CALL)
Can compute PUT X, CALL X, or both.
Can use a target delta approach or a 1‑sigma move approach.
Volatility input can be HV (log returns) or ATR, with configurable lookback lengths and caps/floors.
2) Expiry / settlement controls
Settlement is aligned to next Friday with a configurable timezone + settle hour/minute (e.g., Fri 16:00 New York).
3) Strike rounding + optional “snap”
Rounds strikes to your chosen strike increment (e.g., 5‑point spacing for index products).
Optional “snap” can align X to nearby prior daily/weekly key levels (H/L/C/Mid) rather than purely model output.
4) Locking workflow (Mon / Tue / Wed)
You can enable locking on Monday, Tuesday, and/or Wednesday.
Locks occur on the daily close (confirmed bar), and once locked, the level is held for the week.
5) Visual plotting
Plots the locked X levels as horizontal lines extended to the right:
PUT lines are solid, CALL lines are dashed, and
Lines are color‑coded by lock day (Mon/Tue/Wed).
6) Touch/Breach tracking
Tracks whether price touched/breached the locked X during the week (after the lock moment).
7) Friday settlement result (win/loss)
On Friday’s confirmed close, evaluates results:
Short PUT considered a win if settle > put strike
Short CALL considered a win if settle < call strike
8) Table dashboard (weekly “control panel”)
The table is meant to be your weekly at‑a‑glance tracker. For each lock day and each side it can show:
Locked strike (X),
“Now” distance from price,
Touch status,
Settle status (once Friday passes),
W% = a real‑time probability estimate (normal approximation).
Important: W% is a real‑time probability estimate, not a historical win‑rate backtest.
9) RSI context + RSI alerts
Optional RSI context in the table and RSI‑based bias framing.
Includes alert conditions for RSI crossing above/below 50 (useful for regime shifts).
Recommended chart setup / best practices
This tracker is intentionally built around daily locking, and is designed for 1D charts where the lock event is the daily close.
Make sure your settlement timezone/time matches the product you’re trading (and your intended settlement convention).
If you trade instruments with different strike spacing, update Strike increment accordingly.
Limitations / notes
Probability outputs (W%) are model estimates and can diverge from real option pricing (skew, kurtosis, jumps, event risk, liquidity, etc.).
This is a decision support / tracking tool. It is not an automated execution system, and it does not include slippage/fees in outcomes.
Disclaimer
This indicator is for educational and informational purposes only and does not constitute financial advice. Options involve substantial risk and are not suitable for all traders. Always use defined risk controls and trade within your plan.
Options X Lock Tracker is a weekly trade‑management dashboard for defined‑risk premium selling where the “trade thesis” is primarily about finishing on the correct side of a single level (X) by expiration. In this framework, X is the short strike (the “line”) you sell, and the goal is to remain on the correct side of X through settlement.
This script helps you:
Compute candidate PUT X and/or CALL X levels using a volatility‑based model,
Lock those X levels on specific weekdays (Mon/Tue/Wed),
Track touches/breaches during the week, and
Evaluate win/loss at weekly settlement.
Core features
1) X‑Level computation (PUT and/or CALL)
Can compute PUT X, CALL X, or both.
Can use a target delta approach or a 1‑sigma move approach.
Volatility input can be HV (log returns) or ATR, with configurable lookback lengths and caps/floors.
2) Expiry / settlement controls
Settlement is aligned to next Friday with a configurable timezone + settle hour/minute (e.g., Fri 16:00 New York).
3) Strike rounding + optional “snap”
Rounds strikes to your chosen strike increment (e.g., 5‑point spacing for index products).
Optional “snap” can align X to nearby prior daily/weekly key levels (H/L/C/Mid) rather than purely model output.
4) Locking workflow (Mon / Tue / Wed)
You can enable locking on Monday, Tuesday, and/or Wednesday.
Locks occur on the daily close (confirmed bar), and once locked, the level is held for the week.
5) Visual plotting
Plots the locked X levels as horizontal lines extended to the right:
PUT lines are solid, CALL lines are dashed, and
Lines are color‑coded by lock day (Mon/Tue/Wed).
6) Touch/Breach tracking
Tracks whether price touched/breached the locked X during the week (after the lock moment).
7) Friday settlement result (win/loss)
On Friday’s confirmed close, evaluates results:
Short PUT considered a win if settle > put strike
Short CALL considered a win if settle < call strike
8) Table dashboard (weekly “control panel”)
The table is meant to be your weekly at‑a‑glance tracker. For each lock day and each side it can show:
Locked strike (X),
“Now” distance from price,
Touch status,
Settle status (once Friday passes),
W% = a real‑time probability estimate (normal approximation).
Important: W% is a real‑time probability estimate, not a historical win‑rate backtest.
9) RSI context + RSI alerts
Optional RSI context in the table and RSI‑based bias framing.
Includes alert conditions for RSI crossing above/below 50 (useful for regime shifts).
Recommended chart setup / best practices
This tracker is intentionally built around daily locking, and is designed for 1D charts where the lock event is the daily close.
Make sure your settlement timezone/time matches the product you’re trading (and your intended settlement convention).
If you trade instruments with different strike spacing, update Strike increment accordingly.
Limitations / notes
Probability outputs (W%) are model estimates and can diverge from real option pricing (skew, kurtosis, jumps, event risk, liquidity, etc.).
This is a decision support / tracking tool. It is not an automated execution system, and it does not include slippage/fees in outcomes.
Disclaimer
This indicator is for educational and informational purposes only and does not constitute financial advice. Options involve substantial risk and are not suitable for all traders. Always use defined risk controls and trade within your plan.
开源脚本
秉承TradingView的精神,该脚本的作者将其开源,以便交易者可以查看和验证其功能。向作者致敬!您可以免费使用该脚本,但请记住,重新发布代码须遵守我们的网站规则。

免责声明
这些信息和出版物并非旨在提供,也不构成TradingView提供或认可的任何形式的财务、投资、交易或其他类型的建议或推荐。请阅读使用条款了解更多信息。
开源脚本
秉承TradingView的精神,该脚本的作者将其开源,以便交易者可以查看和验证其功能。向作者致敬!您可以免费使用该脚本,但请记住,重新发布代码须遵守我们的网站规则。
免责声明
这些信息和出版物并非旨在提供,也不构成TradingView提供或认可的任何形式的财务、投资、交易或其他类型的建议或推荐。请阅读使用条款了解更多信息。