Profit Scouter
OVERVIEW
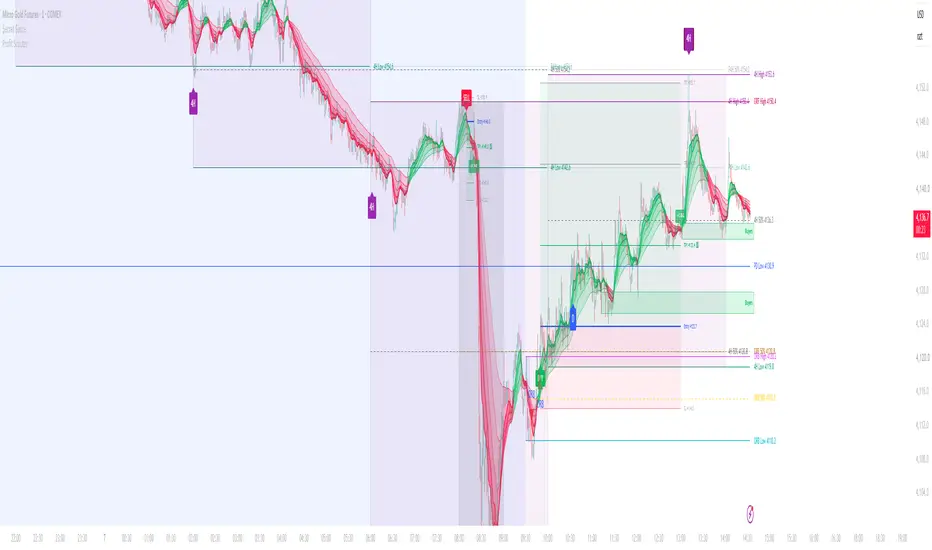
Profit Scouter is an intraday trade-signal indicator for 1–5 minute charts, designed around Micro Gold futures (MGC) but usable on other futures. It combines four Candle Range Theory (CRT) models and a New York Opening Range Breakout (ORB), then plots each signal as a complete trade plan: entry, stop loss and three take-profit levels, with built-in position sizing and a running scorecard.
SIGNAL MODELS
Each CRT model uses a reference candle's high, low and 50% midpoint:
- Daily CRT – previous trading day's range
- 4H CRT – previous 4-hour candle (anchored to New York 1/5/9 AM by default, or the exchange's 6 PM schedule)
- 8–9 AM CRT – the 8:00–9:00 AM New York candle
- Hourly CRT – the previous hour's candle
- NY ORB – first close beyond the opening range (default 9:30–9:45 AM New York)
A CRT signal requires price to sweep beyond the range high or low, then confirm a reversal back inside it. Three confirmation modes are available:
- CISD (default) – a close back through the open of the move that made the sweep
- HTF candle close – strict three-candle CRT: the reference timeframe's candle must close back inside the range, and entry is taken in the discount (longs) or premium (shorts) half
- Fast – the first lower-timeframe close back inside the range
If the sweep extends further than a set fraction of the range (default 50%), it is treated as a genuine breakout and the setup is cancelled.
TRADE PLAN
- Stop: just beyond the sweep wick for CRT trades; the ORB midpoint for ORB trades
- CRT targets: TP1 = 50% level, TP2 = opposite side of the range, TP3 = an extension beyond it
- ORB targets: 1R / 2R / 3R (adjustable)
- Management: 1/3 taken at each target; the stop can move to breakeven after TP1 and to TP1 after TP2 (both optional); the final third can exit at TP3 or trail by ATR
- Position size is calculated from your dollar risk per trade and the instrument's point value
When several models trigger at once, priority is Daily → 4H → 8–9 AM → Hourly → ORB, and only one trade is open at a time.
FILTERS
- Trading window and end-of-day exit (New York time)
- Entry block around the 8:30 AM data releases and on abnormally large candles
- Maximum and minimum stop size, minimum reward-to-risk to the opposite side of the range
- Daily trade limit and stop-after-losses limit
- Optional: market regime filter (higher-timeframe ADX + EMA stack, or ribbon direction), daily 50% premium/discount filter, minimum TP1 distance, extreme-volatility filter
VISUALS
- 8/13/21/34/55 EMA trend ribbon (lines, fill or cloud)
- Live trade zone with Entry / SL / TP tags; finished trades stay on the chart with hit targets marked ✅ and stopped trades ❌
- Optional CRT / ORB level lines and markers for setups that were filtered out (hover for the reason)
- Panel showing trend, regime, current signal, levels, targets hit, and results
SCORECARD
The panel tracks trade count, win rate, net R and average R per trade, overall and per model. These figures are hypothetical and based on simplifying assumptions: entries at the signal candle's close, a fixed round-trip cost per contract (default $3), scaling out in thirds, and the stop assumed to be hit first when a stop and target fall within the same candle. They do not account for slippage beyond the cost setting, partial fills or position-size rounding, and they only cover the history loaded on your chart. Use them to compare settings, not as a forecast of future results.
ALERTS
Create one alert with the condition "Any alert() function call" to receive entries (with SL and all targets), TP1/TP2 hits with stop-move instructions, and trade exits. Separate alert conditions for buy, sell, TP1, TP2 and trade closed are also available. Alerts only fire on live data, not on historical bars or Bar Replay.
NOTES
Signals are confirmed on candle close. This script is an analysis tool, not financial advice. Past signals and scorecard results do not guarantee future performance.
Profit Scouter is an intraday trade-signal indicator for 1–5 minute charts, designed around Micro Gold futures (MGC) but usable on other futures. It combines four Candle Range Theory (CRT) models and a New York Opening Range Breakout (ORB), then plots each signal as a complete trade plan: entry, stop loss and three take-profit levels, with built-in position sizing and a running scorecard.
SIGNAL MODELS
Each CRT model uses a reference candle's high, low and 50% midpoint:
- Daily CRT – previous trading day's range
- 4H CRT – previous 4-hour candle (anchored to New York 1/5/9 AM by default, or the exchange's 6 PM schedule)
- 8–9 AM CRT – the 8:00–9:00 AM New York candle
- Hourly CRT – the previous hour's candle
- NY ORB – first close beyond the opening range (default 9:30–9:45 AM New York)
A CRT signal requires price to sweep beyond the range high or low, then confirm a reversal back inside it. Three confirmation modes are available:
- CISD (default) – a close back through the open of the move that made the sweep
- HTF candle close – strict three-candle CRT: the reference timeframe's candle must close back inside the range, and entry is taken in the discount (longs) or premium (shorts) half
- Fast – the first lower-timeframe close back inside the range
If the sweep extends further than a set fraction of the range (default 50%), it is treated as a genuine breakout and the setup is cancelled.
TRADE PLAN
- Stop: just beyond the sweep wick for CRT trades; the ORB midpoint for ORB trades
- CRT targets: TP1 = 50% level, TP2 = opposite side of the range, TP3 = an extension beyond it
- ORB targets: 1R / 2R / 3R (adjustable)
- Management: 1/3 taken at each target; the stop can move to breakeven after TP1 and to TP1 after TP2 (both optional); the final third can exit at TP3 or trail by ATR
- Position size is calculated from your dollar risk per trade and the instrument's point value
When several models trigger at once, priority is Daily → 4H → 8–9 AM → Hourly → ORB, and only one trade is open at a time.
FILTERS
- Trading window and end-of-day exit (New York time)
- Entry block around the 8:30 AM data releases and on abnormally large candles
- Maximum and minimum stop size, minimum reward-to-risk to the opposite side of the range
- Daily trade limit and stop-after-losses limit
- Optional: market regime filter (higher-timeframe ADX + EMA stack, or ribbon direction), daily 50% premium/discount filter, minimum TP1 distance, extreme-volatility filter
VISUALS
- 8/13/21/34/55 EMA trend ribbon (lines, fill or cloud)
- Live trade zone with Entry / SL / TP tags; finished trades stay on the chart with hit targets marked ✅ and stopped trades ❌
- Optional CRT / ORB level lines and markers for setups that were filtered out (hover for the reason)
- Panel showing trend, regime, current signal, levels, targets hit, and results
SCORECARD
The panel tracks trade count, win rate, net R and average R per trade, overall and per model. These figures are hypothetical and based on simplifying assumptions: entries at the signal candle's close, a fixed round-trip cost per contract (default $3), scaling out in thirds, and the stop assumed to be hit first when a stop and target fall within the same candle. They do not account for slippage beyond the cost setting, partial fills or position-size rounding, and they only cover the history loaded on your chart. Use them to compare settings, not as a forecast of future results.
ALERTS
Create one alert with the condition "Any alert() function call" to receive entries (with SL and all targets), TP1/TP2 hits with stop-move instructions, and trade exits. Separate alert conditions for buy, sell, TP1, TP2 and trade closed are also available. Alerts only fire on live data, not on historical bars or Bar Replay.
NOTES
Signals are confirmed on candle close. This script is an analysis tool, not financial advice. Past signals and scorecard results do not guarantee future performance.

1 Trade Away
免责声明
这些信息和出版物并非旨在提供,也不构成TradingView提供或认可的任何形式的财务、投资、交易或其他类型的建议或推荐。请阅读使用条款了解更多信息。