OPEN-SOURCE SCRIPT
EMA Distance
Introduction
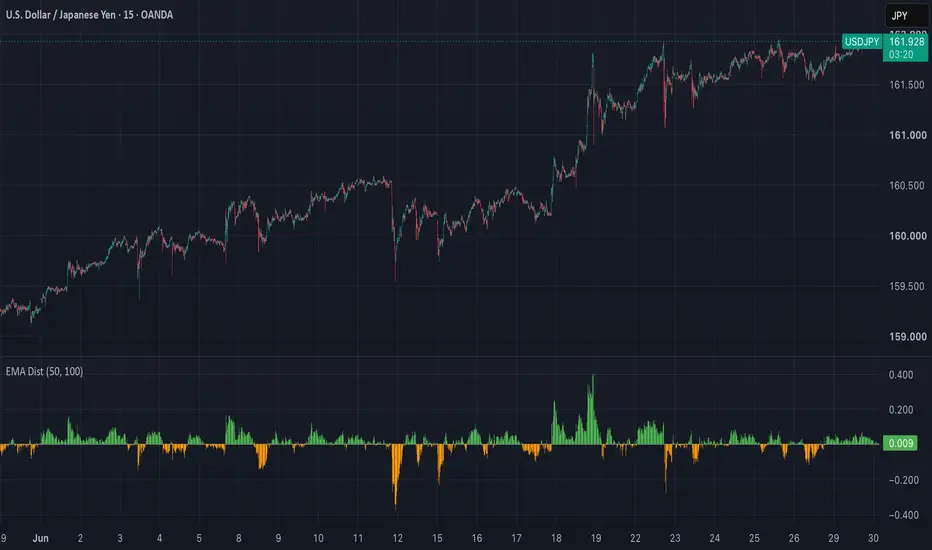
EMA Distance is a simple trend analysis indicator that measures how far the current price is trading from an Exponential Moving Average (EMA).
While an EMA helps identify the prevailing market trend, it does not indicate whether price is trading close to its average value or has extended significantly away from it. EMA Distance addresses this by expressing the difference between price and the EMA as a percentage, providing a normalized view of price extension.
The indicator is displayed as a histogram centered around a zero line, making it easy to distinguish whether price is trading above or below the selected EMA.
How It Works
The indicator first calculates an Exponential Moving Average using the selected EMA Length.
It then measures the percentage distance between the current closing price and the EMA using the following calculation:
EMA Distance = ((Close − EMA) / EMA) × Scale Factor
Positive values indicate that price is trading above the EMA.
Negative values indicate that price is trading below the EMA.
Larger positive or negative values indicate that price is moving further away from its average, while values closer to zero suggest that price is trading near the EMA.
Key Features
Percentage-Based Measurement
EMA Distance expresses the difference between price and the EMA as a percentage, making the indicator applicable across different markets and price levels.
Quick Trend Bias
The zero line immediately shows whether price is trading above or below the selected EMA.
Monitor Price Extension
Large positive or negative values may indicate that price has moved significantly away from its average and could be approaching a temporary overextended condition.
Lightweight and Fast
The indicator uses a simple calculation that is suitable for all markets and timeframes.
Interpretation
Above Zero
Positive values indicate that price is trading above the EMA, suggesting bullish market conditions.
The larger the value, the further price has moved above its average.
Below Zero
Negative values indicate that price is trading below the EMA, suggesting bearish market conditions.
Increasingly negative values reflect greater downside extension.
Near Zero
Values close to zero indicate that price is trading near the EMA.
This often occurs during consolidations, pullbacks, or periods of reduced momentum.
Expanding Distance
When the histogram continues moving away from zero, price is increasing its distance from the EMA.
This may reflect strengthening momentum but can also indicate that the market is becoming increasingly extended.
Contracting Distance
When the histogram moves back toward zero, price is returning closer to its average.
This often occurs during pullbacks, consolidations, or weakening trends.
Alert Conditions
The indicator includes two built-in alert conditions:
Price Crossed Above EMA
- Triggered when the EMA Distance crosses above zero, indicating that price has moved above the selected EMA.
Price Crossed Below EMA
- Triggered when the EMA Distance crosses below zero, indicating that price has moved below the selected EMA.
These alerts help traders monitor changes in market bias without continuously watching the chart.
Example Applications
- Identifying bullish or bearish market bias.
- Measuring how far price has extended from the EMA.
- Monitoring pullbacks toward the moving average.
- Comparing trend extension across different markets and timeframes.
- Supporting trend-following strategies by observing price location relative to the EMA.
Notes
EMA Distance is designed as a market context indicator rather than a standalone trading system.
A large distance from the EMA does not necessarily indicate an immediate reversal. Strong trends can remain extended for prolonged periods before retracing.
For best results, combine EMA Distance with price action, support and resistance, and other trend analysis techniques to better understand overall market conditions.
EMA Distance provides a simple way to visualize how far price has moved from its average, helping traders evaluate trend extension, market bias, and potential pullback opportunities.
EMA Distance is a simple trend analysis indicator that measures how far the current price is trading from an Exponential Moving Average (EMA).
While an EMA helps identify the prevailing market trend, it does not indicate whether price is trading close to its average value or has extended significantly away from it. EMA Distance addresses this by expressing the difference between price and the EMA as a percentage, providing a normalized view of price extension.
The indicator is displayed as a histogram centered around a zero line, making it easy to distinguish whether price is trading above or below the selected EMA.
How It Works
The indicator first calculates an Exponential Moving Average using the selected EMA Length.
It then measures the percentage distance between the current closing price and the EMA using the following calculation:
EMA Distance = ((Close − EMA) / EMA) × Scale Factor
Positive values indicate that price is trading above the EMA.
Negative values indicate that price is trading below the EMA.
Larger positive or negative values indicate that price is moving further away from its average, while values closer to zero suggest that price is trading near the EMA.
Key Features
Percentage-Based Measurement
EMA Distance expresses the difference between price and the EMA as a percentage, making the indicator applicable across different markets and price levels.
Quick Trend Bias
The zero line immediately shows whether price is trading above or below the selected EMA.
Monitor Price Extension
Large positive or negative values may indicate that price has moved significantly away from its average and could be approaching a temporary overextended condition.
Lightweight and Fast
The indicator uses a simple calculation that is suitable for all markets and timeframes.
Interpretation
Above Zero
Positive values indicate that price is trading above the EMA, suggesting bullish market conditions.
The larger the value, the further price has moved above its average.
Below Zero
Negative values indicate that price is trading below the EMA, suggesting bearish market conditions.
Increasingly negative values reflect greater downside extension.
Near Zero
Values close to zero indicate that price is trading near the EMA.
This often occurs during consolidations, pullbacks, or periods of reduced momentum.
Expanding Distance
When the histogram continues moving away from zero, price is increasing its distance from the EMA.
This may reflect strengthening momentum but can also indicate that the market is becoming increasingly extended.
Contracting Distance
When the histogram moves back toward zero, price is returning closer to its average.
This often occurs during pullbacks, consolidations, or weakening trends.
Alert Conditions
The indicator includes two built-in alert conditions:
Price Crossed Above EMA
- Triggered when the EMA Distance crosses above zero, indicating that price has moved above the selected EMA.
Price Crossed Below EMA
- Triggered when the EMA Distance crosses below zero, indicating that price has moved below the selected EMA.
These alerts help traders monitor changes in market bias without continuously watching the chart.
Example Applications
- Identifying bullish or bearish market bias.
- Measuring how far price has extended from the EMA.
- Monitoring pullbacks toward the moving average.
- Comparing trend extension across different markets and timeframes.
- Supporting trend-following strategies by observing price location relative to the EMA.
Notes
EMA Distance is designed as a market context indicator rather than a standalone trading system.
A large distance from the EMA does not necessarily indicate an immediate reversal. Strong trends can remain extended for prolonged periods before retracing.
For best results, combine EMA Distance with price action, support and resistance, and other trend analysis techniques to better understand overall market conditions.
EMA Distance provides a simple way to visualize how far price has moved from its average, helping traders evaluate trend extension, market bias, and potential pullback opportunities.
开源脚本
秉承TradingView的精神,该脚本的作者将其开源,以便交易者可以查看和验证其功能。向作者致敬!您可以免费使用该脚本,但请记住,重新发布代码须遵守我们的网站规则。

免责声明
这些信息和出版物并非旨在提供,也不构成TradingView提供或认可的任何形式的财务、投资、交易或其他类型的建议或推荐。请阅读使用条款了解更多信息。
开源脚本
秉承TradingView的精神,该脚本的作者将其开源,以便交易者可以查看和验证其功能。向作者致敬!您可以免费使用该脚本,但请记住,重新发布代码须遵守我们的网站规则。
免责声明
这些信息和出版物并非旨在提供,也不构成TradingView提供或认可的任何形式的财务、投资、交易或其他类型的建议或推荐。请阅读使用条款了解更多信息。