Volume Divergence & Bayesian Projection
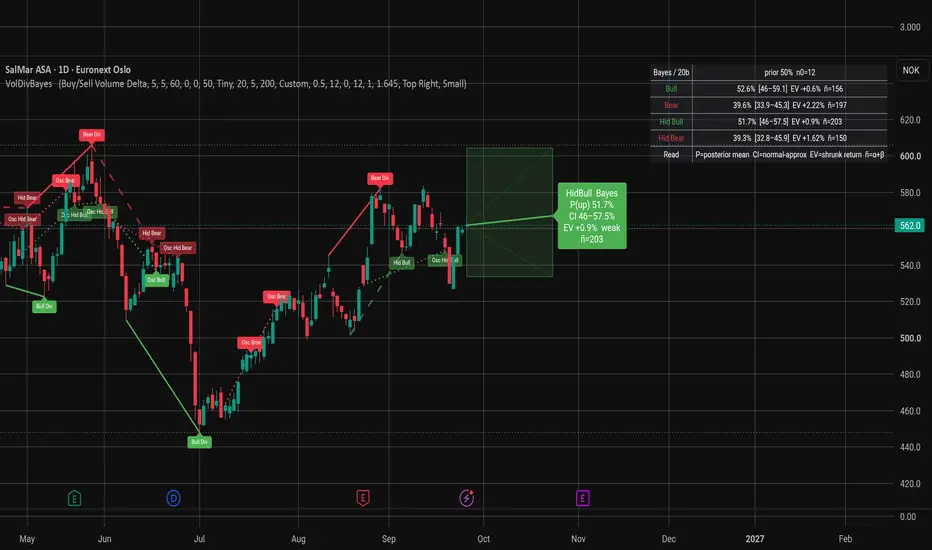
Volume Divergence & Bayesian Projection
A statistical edge engine for volume-price divergences
Overview
This indicator detects volume divergences — moments when price and volume disagree — and then applies Bayesian inference to answer a question most divergence tools ignore:
"Historically, when this exact signal fired, what actually happened next?"
Rather than just drawing a line and leaving you to guess, it learns from every completed signal on the chart and projects a probability distribution of the forward move — complete with a credible interval, an expected value, and an effective sample size.
What Makes It Different
Most divergence indicators stop at detection. This one closes the loop:
Typical divergence tool This indicator
Draws a line, labels it "Bull" Draws a line, labels it, then learns from the outcome
Same logic for every signal Two independent detection methods feed the engine
No feedback Bayesian posterior updates with every completed signal
No uncertainty measure Credible interval + effective sample size shown live
"This looks bullish" "62% historical hit rate, CI 54–70%, EV +1.8%, ñ=41"
The result is a tool that gets more informative the longer you use it on a given symbol and timeframe.
Detection: Two Complementary Methods
Divergences are found by comparing pivots in price against pivots in a volume oscillator. The script supports two independent approaches, which can run together or separately:
1. Price-Pivot Method
Volume divergence at price swings
Detects when price makes a new high/low but volume fails to confirm. This is the classic exhaustion signal — the move is running out of participation.
2. Oscillator-Pivot Method
Price divergence at volume swings
Detects when volume makes a new extreme but price fails to follow. This is the absorption signal — someone is quietly taking the other side.
These detect genuinely different market phenomena. Running both together gives you the union of signals; running one at a time lets you compare their behavior directly.
Signal Types
Four divergence classes are detected:
Signal Regular (Reversal) Hidden (Continuation)
Bullish Price LL + Volume HL Price HL + Volume LL
Bearish Price HH + Volume LH Price LH + Volume HH
Regular divergences suggest a reversal is near
Hidden divergences suggest the existing trend will continue
All four are tracked and learned from independently.
The Bayesian Engine
This is the core of the indicator. For each of the four signal types, the script maintains:
A Beta-Bernoulli posterior — "Does the signal work?"
Tracks the probability that the expected directional move occurs within N bars
Configurable prior: Uniform, Jeffreys, Skeptical, or fully Custom
Recency decay lets recent outcomes matter more than old ones
Credible interval (via Z-score) shows the uncertainty band around the estimate
A Normal posterior on return magnitude — "How big is the move?"
Tracks the expected forward return with its own prior and shrinkage
Returns are shrunk toward the prior mean, preventing small-sample overconfidence
An empirical return buffer
Stores the last maxSamples returns per signal type
Used to compute Q25/Q75 for the projection box's range
Effective sample size (ñ)
ñ = α + β
Shrinks toward the prior when few observations exist, grows as evidence accumulates
Projections are gated on a minimum ñ, so you never see a projection built on 2 signals
Visualization
Divergence labels & lines
Solid lines connect regular divergence pivots
Dashed lines connect hidden divergences
Dotted lines (optional) connect oscillator-pivot divergences
All label colors, text color, transparency, and size are fully customizable
Projection (last bar only)
When the most recent signal has enough evidence, the script draws:
A shaded box spanning the Q25–Q75 range of past outcomes
A median line showing the expected return
A label with the full statistical readout:
Posterior probability
Credible interval
Expected value
Whether the CI excludes 50% (statistical edge)
Effective sample size
The box's opacity scales with confidence — stronger edges are more visually prominent.
Stats table
A live table showing, for all four signal types:
Posterior mean P
Credible interval
Expected value
Effective sample size
Fully customizable: 9 positions, background color, border color, text size.
Alerts
Four alert conditions, one per signal type:
Bullish Divergence
Bearish Divergence
Hidden Bullish Divergence
Hidden Bearish Divergence
Running the indicator twice (once per detection method) gives you eight independent alerts — one per method per signal type.
Configuration
Group Controls
Settings Volume source (Delta or OBV), pivot sensitivity, lookback window
Filters Minimum price change %, minimum volume change %
Methods Toggle price-pivot and oscillator-pivot detection independently
Display Show/hide regular, hidden, lines, oscillator lines; bull/bear colors
Labels Label background colors, text color, hidden fade, size
Projection Forward bars, min samples, max stored outcomes
Bayesian Prior type, prior strength, prior mean, decay, CI Z-score, edge filter
Table Position, background, border, text size
How to Use It
Add to a chart on your instrument and timeframe
Let it run — the engine learns from every completed signal
Watch the stats table to see which signal types have a real edge on this market
Interpret the projection on the last bar:
High P + tight CI + positive EV = strong signal
Wide CI or low ñ = insufficient evidence, ignore
Optional — split the methods: Add the indicator twice, one method each, to compare price-pivot vs oscillator-pivot performance independently
Honest Limitations
Signals are confirmed, not predictive: Pivots require pivotRight bars to form, so signals appear with a delay of N bars. This is a fact of pivot-based detection, not a bug.
Learning requires history: The Bayesian engine needs completed outcomes to be useful. On a fresh chart, projections are gated until minSamples is reached.
Past statistics do not guarantee future results: The posterior describes what has happened, not what will happen. It is a probabilistic tool, not a crystal ball.
Two detection methods share posteriors by default: If you want method-specific statistics, run two instances of the indicator.
Summary
Volume Divergence & Bayesian Projection is not just another divergence indicator. It is a self-learning statistical framework for evaluating whether volume divergences actually work on the instrument you trade.
It detects. It learns. It quantifies uncertainty. And it tells you, in plain numbers, whether the signal in front of you is worth acting on — or just noise.
For educational and research purposes. Not financial advice. Always validate on your own data before risking capital.
A statistical edge engine for volume-price divergences
Overview
This indicator detects volume divergences — moments when price and volume disagree — and then applies Bayesian inference to answer a question most divergence tools ignore:
"Historically, when this exact signal fired, what actually happened next?"
Rather than just drawing a line and leaving you to guess, it learns from every completed signal on the chart and projects a probability distribution of the forward move — complete with a credible interval, an expected value, and an effective sample size.
What Makes It Different
Most divergence indicators stop at detection. This one closes the loop:
Typical divergence tool This indicator
Draws a line, labels it "Bull" Draws a line, labels it, then learns from the outcome
Same logic for every signal Two independent detection methods feed the engine
No feedback Bayesian posterior updates with every completed signal
No uncertainty measure Credible interval + effective sample size shown live
"This looks bullish" "62% historical hit rate, CI 54–70%, EV +1.8%, ñ=41"
The result is a tool that gets more informative the longer you use it on a given symbol and timeframe.
Detection: Two Complementary Methods
Divergences are found by comparing pivots in price against pivots in a volume oscillator. The script supports two independent approaches, which can run together or separately:
1. Price-Pivot Method
Volume divergence at price swings
Detects when price makes a new high/low but volume fails to confirm. This is the classic exhaustion signal — the move is running out of participation.
2. Oscillator-Pivot Method
Price divergence at volume swings
Detects when volume makes a new extreme but price fails to follow. This is the absorption signal — someone is quietly taking the other side.
These detect genuinely different market phenomena. Running both together gives you the union of signals; running one at a time lets you compare their behavior directly.
Signal Types
Four divergence classes are detected:
Signal Regular (Reversal) Hidden (Continuation)
Bullish Price LL + Volume HL Price HL + Volume LL
Bearish Price HH + Volume LH Price LH + Volume HH
Regular divergences suggest a reversal is near
Hidden divergences suggest the existing trend will continue
All four are tracked and learned from independently.
The Bayesian Engine
This is the core of the indicator. For each of the four signal types, the script maintains:
A Beta-Bernoulli posterior — "Does the signal work?"
Tracks the probability that the expected directional move occurs within N bars
Configurable prior: Uniform, Jeffreys, Skeptical, or fully Custom
Recency decay lets recent outcomes matter more than old ones
Credible interval (via Z-score) shows the uncertainty band around the estimate
A Normal posterior on return magnitude — "How big is the move?"
Tracks the expected forward return with its own prior and shrinkage
Returns are shrunk toward the prior mean, preventing small-sample overconfidence
An empirical return buffer
Stores the last maxSamples returns per signal type
Used to compute Q25/Q75 for the projection box's range
Effective sample size (ñ)
ñ = α + β
Shrinks toward the prior when few observations exist, grows as evidence accumulates
Projections are gated on a minimum ñ, so you never see a projection built on 2 signals
Visualization
Divergence labels & lines
Solid lines connect regular divergence pivots
Dashed lines connect hidden divergences
Dotted lines (optional) connect oscillator-pivot divergences
All label colors, text color, transparency, and size are fully customizable
Projection (last bar only)
When the most recent signal has enough evidence, the script draws:
A shaded box spanning the Q25–Q75 range of past outcomes
A median line showing the expected return
A label with the full statistical readout:
Posterior probability
Credible interval
Expected value
Whether the CI excludes 50% (statistical edge)
Effective sample size
The box's opacity scales with confidence — stronger edges are more visually prominent.
Stats table
A live table showing, for all four signal types:
Posterior mean P
Credible interval
Expected value
Effective sample size
Fully customizable: 9 positions, background color, border color, text size.
Alerts
Four alert conditions, one per signal type:
Bullish Divergence
Bearish Divergence
Hidden Bullish Divergence
Hidden Bearish Divergence
Running the indicator twice (once per detection method) gives you eight independent alerts — one per method per signal type.
Configuration
Group Controls
Settings Volume source (Delta or OBV), pivot sensitivity, lookback window
Filters Minimum price change %, minimum volume change %
Methods Toggle price-pivot and oscillator-pivot detection independently
Display Show/hide regular, hidden, lines, oscillator lines; bull/bear colors
Labels Label background colors, text color, hidden fade, size
Projection Forward bars, min samples, max stored outcomes
Bayesian Prior type, prior strength, prior mean, decay, CI Z-score, edge filter
Table Position, background, border, text size
How to Use It
Add to a chart on your instrument and timeframe
Let it run — the engine learns from every completed signal
Watch the stats table to see which signal types have a real edge on this market
Interpret the projection on the last bar:
High P + tight CI + positive EV = strong signal
Wide CI or low ñ = insufficient evidence, ignore
Optional — split the methods: Add the indicator twice, one method each, to compare price-pivot vs oscillator-pivot performance independently
Honest Limitations
Signals are confirmed, not predictive: Pivots require pivotRight bars to form, so signals appear with a delay of N bars. This is a fact of pivot-based detection, not a bug.
Learning requires history: The Bayesian engine needs completed outcomes to be useful. On a fresh chart, projections are gated until minSamples is reached.
Past statistics do not guarantee future results: The posterior describes what has happened, not what will happen. It is a probabilistic tool, not a crystal ball.
Two detection methods share posteriors by default: If you want method-specific statistics, run two instances of the indicator.
Summary
Volume Divergence & Bayesian Projection is not just another divergence indicator. It is a self-learning statistical framework for evaluating whether volume divergences actually work on the instrument you trade.
It detects. It learns. It quantifies uncertainty. And it tells you, in plain numbers, whether the signal in front of you is worth acting on — or just noise.
For educational and research purposes. Not financial advice. Always validate on your own data before risking capital.

免责声明
这些信息和出版物并非旨在提供,也不构成TradingView提供或认可的任何形式的财务、投资、交易或其他类型的建议或推荐。请阅读使用条款了解更多信息。