Dynamic Fib Fan - Market Structure (BOS/CHoCH)
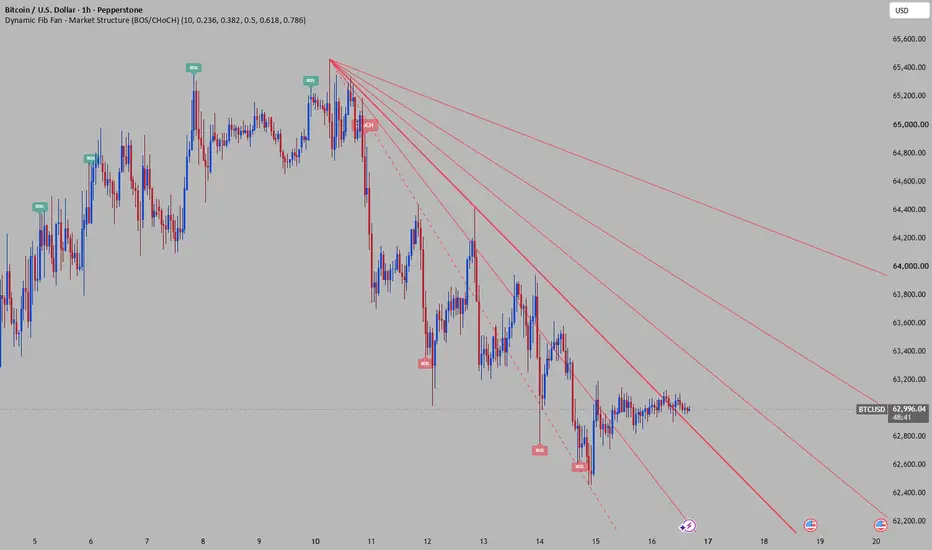
Fibonacci Fan Resistance indicator use as resistance or support integrated with support or resistance.
How this works
Pivot Period (Lookback): By default, this uses 10 candles on the left and right to confirm a swing high/low. You can tighten this to 5 for faster, short-term trends, or expand it to 20 for macroeconomic moves.
BoS & CHoCH Logic:
A Break of Structure (BoS) happens when a trend continues by breaking and closing past the most recently confirmed Pivot point.
A Change of Character (CHoCH) happens when the price reverses and breaks the structural extreme of the opposing side (e.g., in a Bull market, closing beneath the last valid Higher Low).
The Fibonacci Fan Dynamics: The script relies on barstate.islast to redraw the fan on the active ticker in real-time.
If the market is Bullish, the script locks the start of the Fan to the absolute lowest point before the run started. It tracks the highest high dynamically, extending the Fan support upwards.
If a Bearish CHoCH occurs, the script instantly anchors a new Fan to the highest peak of that bull run, and projects the Fan downwards tracking the fresh lows as resistance.
How this works
Pivot Period (Lookback): By default, this uses 10 candles on the left and right to confirm a swing high/low. You can tighten this to 5 for faster, short-term trends, or expand it to 20 for macroeconomic moves.
BoS & CHoCH Logic:
A Break of Structure (BoS) happens when a trend continues by breaking and closing past the most recently confirmed Pivot point.
A Change of Character (CHoCH) happens when the price reverses and breaks the structural extreme of the opposing side (e.g., in a Bull market, closing beneath the last valid Higher Low).
The Fibonacci Fan Dynamics: The script relies on barstate.islast to redraw the fan on the active ticker in real-time.
If the market is Bullish, the script locks the start of the Fan to the absolute lowest point before the run started. It tracks the highest high dynamically, extending the Fan support upwards.
If a Bearish CHoCH occurs, the script instantly anchors a new Fan to the highest peak of that bull run, and projects the Fan downwards tracking the fresh lows as resistance.

免责声明
这些信息和出版物并非旨在提供,也不构成TradingView提供或认可的任何形式的财务、投资、交易或其他类型的建议或推荐。请阅读使用条款了解更多信息。
免责声明
这些信息和出版物并非旨在提供,也不构成TradingView提供或认可的任何形式的财务、投资、交易或其他类型的建议或推荐。请阅读使用条款了解更多信息。