OPEN-SOURCE SCRIPT
Hourly Candle Open Tracker (R2F)
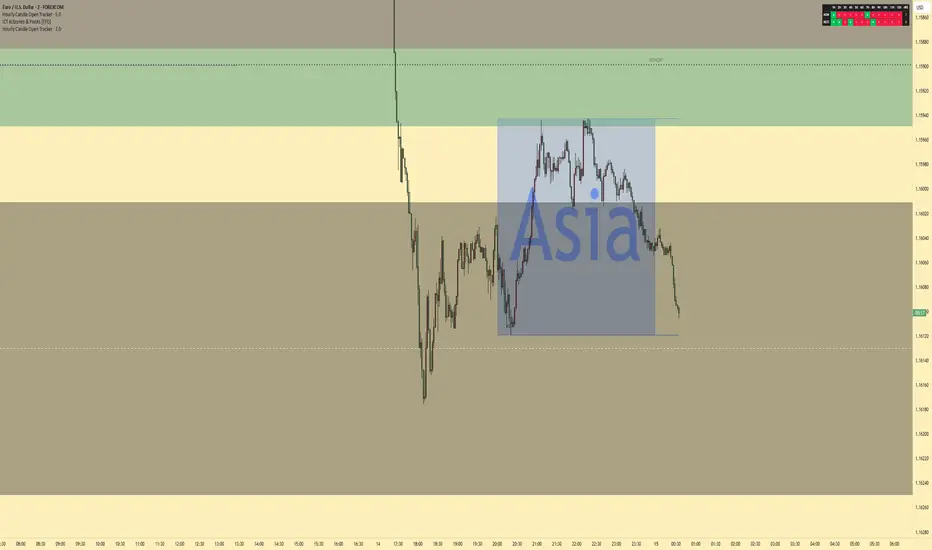
Hourly Candle Start & Formation Tracker
This indicator is designed to help traders clearly identify which hourly candle has started during the current hour, as well as which hourly candle is forming for the next hour.
The tool tracks hourly candle cycles from Hour 1 through Hour 12, making it easier to follow time-based market structure, session rhythm, and candle sequencing directly on your chart.
It provides a simple visual reference for traders who use hourly candle timing as part of their strategy, whether for entries, exits, confirmations, or observing how price behaves as each hourly candle opens and develops.
Key Features
Identifies the current hourly candle that has started
Shows which hourly candle is forming next
Covers hourly cycles from 1 to 12
Helps improve awareness of candle timing and session flow
Useful for intraday traders, scalpers, and time-based strategies
Clean and easy-to-read display directly on the chart
How It Can Be Used
This indicator can help traders stay aligned with hourly candle changes and prepare for the next candle formation before it begins. It may be useful for traders who watch specific hourly candles for volatility, reversals, continuation moves, liquidity grabs, or session-based setups.
Disclaimer
This indicator is intended for informational and educational purposes only. It does not provide buy or sell signals and should not be used as financial advice. Always combine it with your own analysis, risk management, and trading plan.
This indicator is designed to help traders clearly identify which hourly candle has started during the current hour, as well as which hourly candle is forming for the next hour.
The tool tracks hourly candle cycles from Hour 1 through Hour 12, making it easier to follow time-based market structure, session rhythm, and candle sequencing directly on your chart.
It provides a simple visual reference for traders who use hourly candle timing as part of their strategy, whether for entries, exits, confirmations, or observing how price behaves as each hourly candle opens and develops.
Key Features
Identifies the current hourly candle that has started
Shows which hourly candle is forming next
Covers hourly cycles from 1 to 12
Helps improve awareness of candle timing and session flow
Useful for intraday traders, scalpers, and time-based strategies
Clean and easy-to-read display directly on the chart
How It Can Be Used
This indicator can help traders stay aligned with hourly candle changes and prepare for the next candle formation before it begins. It may be useful for traders who watch specific hourly candles for volatility, reversals, continuation moves, liquidity grabs, or session-based setups.
Disclaimer
This indicator is intended for informational and educational purposes only. It does not provide buy or sell signals and should not be used as financial advice. Always combine it with your own analysis, risk management, and trading plan.
开源脚本
秉承TradingView的精神,该脚本的作者将其开源,以便交易者可以查看和验证其功能。向作者致敬!您可以免费使用该脚本,但请记住,重新发布代码须遵守我们的网站规则。

免责声明
这些信息和出版物并非旨在提供,也不构成TradingView提供或认可的任何形式的财务、投资、交易或其他类型的建议或推荐。请阅读使用条款了解更多信息。
开源脚本
秉承TradingView的精神,该脚本的作者将其开源,以便交易者可以查看和验证其功能。向作者致敬!您可以免费使用该脚本,但请记住,重新发布代码须遵守我们的网站规则。
免责声明
这些信息和出版物并非旨在提供,也不构成TradingView提供或认可的任何形式的财务、投资、交易或其他类型的建议或推荐。请阅读使用条款了解更多信息。