OPEN-SOURCE SCRIPT
已更新 Smart Money Flow Signals [QuantAlgo] -Add-on Pivot Turns
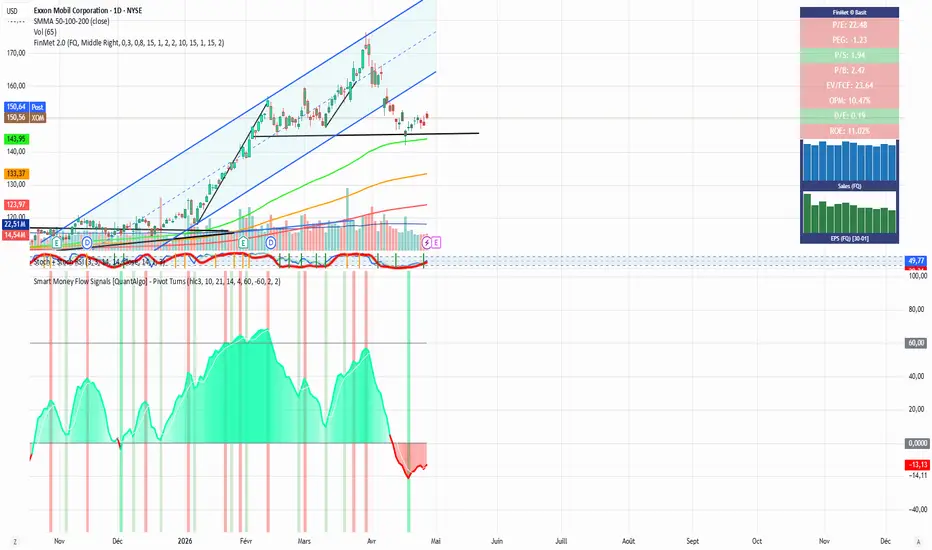
This is an improvement to the original QuantAlgo code designed to detect major pivot points more clearly and make trade entries and exits easier to identify. The goal is to use vertical lines to highlight potential trend reversal zones based on the oscillator’s structure and confirmed pivot behavior.
Reversal logic
If the oscillator is high and a red vertical line appears, it signals a high risk of a trend reversal toward a bearish move.
If the oscillator is low and a green vertical line appears, it signals a high risk of a trend reversal toward a bullish move.
Meaning of the vertical lines
The vertical lines represent likely trend reversal points detected from important oscillator pivots.
In short, they are visual markers meant to help the user spot when momentum is weakening and the market may be preparing to turn in the opposite direction.
Short version
This upgraded QuantAlgo script is built to detect important pivot points in the oscillator so traders can identify better entry and exit zones. Red vertical lines suggest possible bearish reversals from elevated oscillator levels, while green vertical lines suggest possible bullish reversals from depressed oscillator levels.
Natural phrasing
Have fun with it — the idea is simple: the vertical lines mark potential turning points in trend direction, helping the indicator act as a practical reversal-reading tool rather than just a raw oscillator.
Explication francaise
Amélioration du code de QuantAlgo afin de détecter les points de pivot important pour faciliter les entrées/sorties
Si l'oscillateur est élevé + lignes verticale rouge = Risque élevé de revirement de tendance vers une tendance baissiere
Si l'oscillateur est bas + lignes verticale verte = Risque élevé de revirement de tendance vers une tendance haussiere
Bref, les lignes verticales représentent les revirement de tendance.
Have fun!
Reversal logic
If the oscillator is high and a red vertical line appears, it signals a high risk of a trend reversal toward a bearish move.
If the oscillator is low and a green vertical line appears, it signals a high risk of a trend reversal toward a bullish move.
Meaning of the vertical lines
The vertical lines represent likely trend reversal points detected from important oscillator pivots.
In short, they are visual markers meant to help the user spot when momentum is weakening and the market may be preparing to turn in the opposite direction.
Short version
This upgraded QuantAlgo script is built to detect important pivot points in the oscillator so traders can identify better entry and exit zones. Red vertical lines suggest possible bearish reversals from elevated oscillator levels, while green vertical lines suggest possible bullish reversals from depressed oscillator levels.
Natural phrasing
Have fun with it — the idea is simple: the vertical lines mark potential turning points in trend direction, helping the indicator act as a practical reversal-reading tool rather than just a raw oscillator.
Explication francaise
Amélioration du code de QuantAlgo afin de détecter les points de pivot important pour faciliter les entrées/sorties
Si l'oscillateur est élevé + lignes verticale rouge = Risque élevé de revirement de tendance vers une tendance baissiere
Si l'oscillateur est bas + lignes verticale verte = Risque élevé de revirement de tendance vers une tendance haussiere
Bref, les lignes verticales représentent les revirement de tendance.
Have fun!
版本注释
Code improved!开源脚本
秉承TradingView的精神,该脚本的作者将其开源,以便交易者可以查看和验证其功能。向作者致敬!您可以免费使用该脚本,但请记住,重新发布代码须遵守我们的网站规则。

免责声明
这些信息和出版物并非旨在提供,也不构成TradingView提供或认可的任何形式的财务、投资、交易或其他类型的建议或推荐。请阅读使用条款了解更多信息。
免责声明
这些信息和出版物并非旨在提供,也不构成TradingView提供或认可的任何形式的财务、投资、交易或其他类型的建议或推荐。请阅读使用条款了解更多信息。