Support Map
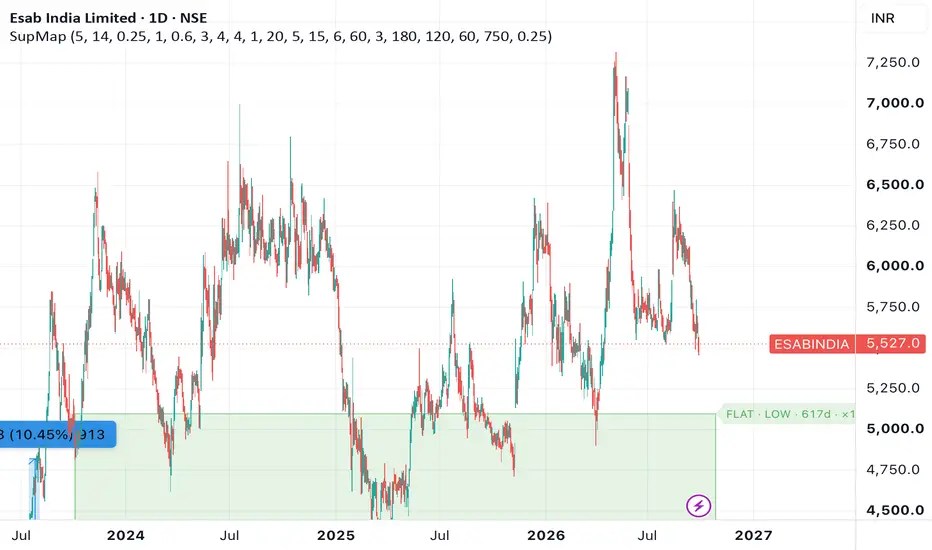
SUPPORT MAP — flat support zones and inclined support, graded by durability
Most support tools mark every swing low and leave you to guess which ones matter. This one answers a different question: how long has this floor actually been respected, and is the structure above it opening up or closing in?
It draws two things.
1. FLAT SUPPORT ZONES
Support is not a line, it is a band. Price reverses across a range, not at a single tick.
Each zone is built from a swing low. The band runs from the wick low, which is the deepest point sellers reached, up to the body bottom of that same candle, where the buying finished and the candle closed. That is the price area where demand actually appeared.
Two guards keep the band sensible, both measured in ATR so the same settings work on a large cap and on a volatile small cap: the band is never thinner than a set fraction of ATR and never thicker than a set multiple of it.
Swing lows close to each other are treated as the same shelf and merged into one zone, with a touch count.
2. RISK GRADING — the core idea
Zones are not graded by how many times they were touched. They are graded by how long the touches span.
Green, LOW risk: first to last touch spans 180 bars or more, roughly three quarters
Amber, MID risk: 120 bars or more, roughly two quarters
Red, HIGH risk: 60 bars or more, roughly one quarter
Below 60 bars: not drawn
A floor that has held across three quarters has survived three earnings cycles and whatever the sector did in between. Touch count alone measures nothing like that. A zone is also discarded if price closed below it between its first and last touch, with a small allowance for noise.
3. INCLINED SUPPORT AND THE UPPER BOUNDARY
The rising support line is not drawn through two chosen points. Two-point trendlines are hostage to a single spike low: one bad anchor and the whole angle is wrong.
Instead the angle is fitted across all the swing lows in the window. The worst spikes are ignored while measuring the angle, then the line is placed so about 20% of lows sit below it. That mirrors what the eye does when you glance at a chart and see the general direction of the lows without checking each wick.
A window only qualifies if the line starts on a real low and if a minimum number of lows actually sit on it. The line must also be within a set ATR distance below current price, so it stays relevant rather than drifting off into old history.
The dashed upper line is fitted independently, never parallel. It is anchored from the highest high in the window and fitted through the highs that followed it, placed so it sits on the highs rather than through them. This matters: a parallel upper line makes every chart look like a healthy channel, which hides the one structure you most need to see.
READING THE OUTPUT
FLAT · LOW · 210d · ×3 845.5–880.8
A flat zone, low risk, touches spanning 210 bars, three touches, band from 845.5 to 880.8
INCLINED · MID · 169d · ×6 on line · base + / highs +
A rising support, mid risk, 169 bars long, six lows sitting on it, base rising and highs rising
When the highs slope down, both lines turn grey and the label adds CONVERGING. Rising lows into falling highs is a closing structure. It resolves one way or the other and the odds are not in the buyer's favour.
INPUTS WORTH ADJUSTING
Swing strength: larger values give fewer, more major levels
Risk thresholds: 180 / 120 / 60 bars, adjust to your own definition of a quarter
Merge within: raise it on high-priced stocks so nearby shelves combine
Minimum lows on the line: 4 by default, drop to 3 if no inclined line appears
Minimum span: lower it if you trade shorter horizons
Lookback: 750 bars, about three years of daily data
NOTES
Built for the daily chart, but it works on any timeframe. On the weekly it finds genuinely long-term floors, which is the right scale for positional work.
One honest limitation: it measures how many bars a low dominated, not how much time or volume price spent at that price. A long consolidation traps far more inventory than a single sharp V-bottom, and both can produce the same swing low. Your eye can tell them apart; the script cannot.
This indicator marks where buyers previously appeared. It does not generate buy or sell signals and it does not predict. Use it alongside your own trend, volume and fundamental checks.
For education only. Not investment advice.
Most support tools mark every swing low and leave you to guess which ones matter. This one answers a different question: how long has this floor actually been respected, and is the structure above it opening up or closing in?
It draws two things.
1. FLAT SUPPORT ZONES
Support is not a line, it is a band. Price reverses across a range, not at a single tick.
Each zone is built from a swing low. The band runs from the wick low, which is the deepest point sellers reached, up to the body bottom of that same candle, where the buying finished and the candle closed. That is the price area where demand actually appeared.
Two guards keep the band sensible, both measured in ATR so the same settings work on a large cap and on a volatile small cap: the band is never thinner than a set fraction of ATR and never thicker than a set multiple of it.
Swing lows close to each other are treated as the same shelf and merged into one zone, with a touch count.
2. RISK GRADING — the core idea
Zones are not graded by how many times they were touched. They are graded by how long the touches span.
Green, LOW risk: first to last touch spans 180 bars or more, roughly three quarters
Amber, MID risk: 120 bars or more, roughly two quarters
Red, HIGH risk: 60 bars or more, roughly one quarter
Below 60 bars: not drawn
A floor that has held across three quarters has survived three earnings cycles and whatever the sector did in between. Touch count alone measures nothing like that. A zone is also discarded if price closed below it between its first and last touch, with a small allowance for noise.
3. INCLINED SUPPORT AND THE UPPER BOUNDARY
The rising support line is not drawn through two chosen points. Two-point trendlines are hostage to a single spike low: one bad anchor and the whole angle is wrong.
Instead the angle is fitted across all the swing lows in the window. The worst spikes are ignored while measuring the angle, then the line is placed so about 20% of lows sit below it. That mirrors what the eye does when you glance at a chart and see the general direction of the lows without checking each wick.
A window only qualifies if the line starts on a real low and if a minimum number of lows actually sit on it. The line must also be within a set ATR distance below current price, so it stays relevant rather than drifting off into old history.
The dashed upper line is fitted independently, never parallel. It is anchored from the highest high in the window and fitted through the highs that followed it, placed so it sits on the highs rather than through them. This matters: a parallel upper line makes every chart look like a healthy channel, which hides the one structure you most need to see.
READING THE OUTPUT
FLAT · LOW · 210d · ×3 845.5–880.8
A flat zone, low risk, touches spanning 210 bars, three touches, band from 845.5 to 880.8
INCLINED · MID · 169d · ×6 on line · base + / highs +
A rising support, mid risk, 169 bars long, six lows sitting on it, base rising and highs rising
When the highs slope down, both lines turn grey and the label adds CONVERGING. Rising lows into falling highs is a closing structure. It resolves one way or the other and the odds are not in the buyer's favour.
INPUTS WORTH ADJUSTING
Swing strength: larger values give fewer, more major levels
Risk thresholds: 180 / 120 / 60 bars, adjust to your own definition of a quarter
Merge within: raise it on high-priced stocks so nearby shelves combine
Minimum lows on the line: 4 by default, drop to 3 if no inclined line appears
Minimum span: lower it if you trade shorter horizons
Lookback: 750 bars, about three years of daily data
NOTES
Built for the daily chart, but it works on any timeframe. On the weekly it finds genuinely long-term floors, which is the right scale for positional work.
One honest limitation: it measures how many bars a low dominated, not how much time or volume price spent at that price. A long consolidation traps far more inventory than a single sharp V-bottom, and both can produce the same swing low. Your eye can tell them apart; the script cannot.
This indicator marks where buyers previously appeared. It does not generate buy or sell signals and it does not predict. Use it alongside your own trend, volume and fundamental checks.
For education only. Not investment advice.

免责声明
这些信息和出版物并非旨在提供,也不构成TradingView提供或认可的任何形式的财务、投资、交易或其他类型的建议或推荐。请阅读使用条款了解更多信息。