OPEN-SOURCE SCRIPT
Wick Snap Pressure [ZOM]
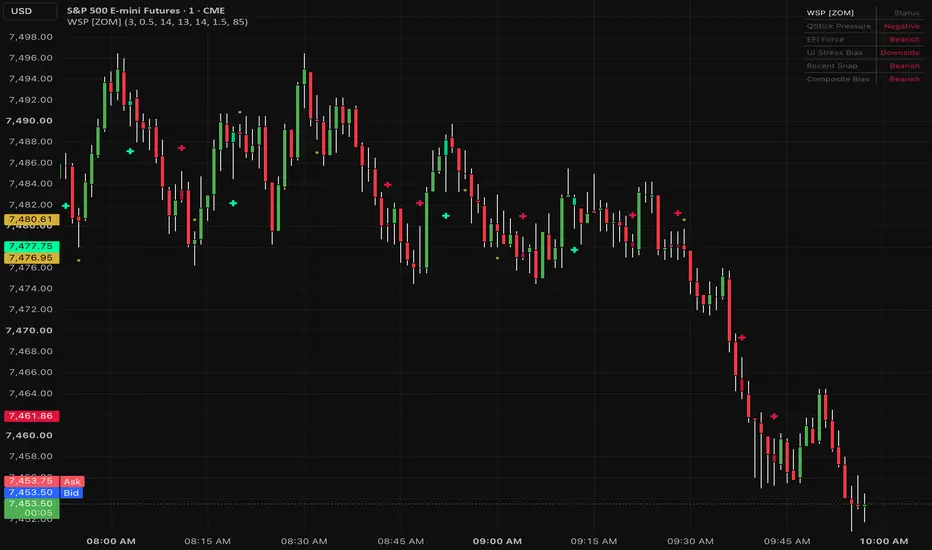
Wick Snap Pressure [ZOM] is an overlay pressure marker designed to highlight meaningful wick rejections only when they are supported by candle pressure, volume impulse, and stress context. The goal is to avoid treating every long wick as a signal. Instead, the script looks for a rejection candle that also has supporting evidence from lesser-used pressure tools.
The calculation combines four parts. First, wick rejection ratio checks whether the upper or lower wick is large enough relative to the candle body and total range to represent a visible rejection. Second, QStick measures smoothed close-minus-open candle pressure, which helps show whether recent candle bodies are leaning bullish or bearish. Third, Elder Force Index measures whether price movement is being supported by volume impulse. Fourth, Ulcer Index stress is used as a context filter so the script can avoid confirming snaps while adverse stress is still expanding.
Bullish watch markers appear when lower-wick rejection and early QStick pressure align before full confirmation. Bullish snap markers require stronger agreement: lower wick rejection, improving bullish QStick behavior, positive Force Index, and non-expanding stress. Bearish watch and bearish snap signals mirror the same logic using upper-wick rejection, negative QStick pressure, negative Force Index, and suitable stress behavior.
The visual layout is intentionally lightweight. It uses subtle bar coloring, small above/below-bar markers, and a compact dashboard instead of projected zones or static drawings. Mint markers represent bullish snap pressure, crimson markers represent bearish snap pressure, and gold watch markers show earlier setups that have not fully confirmed. The dashboard summarizes QStick pressure, Force Index direction, Ulcer stress bias, the most recent snap, and the composite bias.
I use this as a tape-reading and reaction aid around pullbacks, failed pushes, VWAP tests, prior swing levels, and local reversal attempts. It is not a standalone buy/sell system. Strong trend days can produce countertrend wick signals that fail, so the best use is as a confirmation layer alongside market structure, trend, liquidity context, and risk controls.
Key inputs include QStick length, Force Index length, Ulcer Index length, wick/body threshold, signal cooldown, marker offset, dashboard visibility, and palette colors. Lower wick thresholds create more signals. Higher thresholds demand more obvious rejection and reduce signal frequency.
Open-source [ZOM] script for educational use only. Not financial advice.
The calculation combines four parts. First, wick rejection ratio checks whether the upper or lower wick is large enough relative to the candle body and total range to represent a visible rejection. Second, QStick measures smoothed close-minus-open candle pressure, which helps show whether recent candle bodies are leaning bullish or bearish. Third, Elder Force Index measures whether price movement is being supported by volume impulse. Fourth, Ulcer Index stress is used as a context filter so the script can avoid confirming snaps while adverse stress is still expanding.
Bullish watch markers appear when lower-wick rejection and early QStick pressure align before full confirmation. Bullish snap markers require stronger agreement: lower wick rejection, improving bullish QStick behavior, positive Force Index, and non-expanding stress. Bearish watch and bearish snap signals mirror the same logic using upper-wick rejection, negative QStick pressure, negative Force Index, and suitable stress behavior.
The visual layout is intentionally lightweight. It uses subtle bar coloring, small above/below-bar markers, and a compact dashboard instead of projected zones or static drawings. Mint markers represent bullish snap pressure, crimson markers represent bearish snap pressure, and gold watch markers show earlier setups that have not fully confirmed. The dashboard summarizes QStick pressure, Force Index direction, Ulcer stress bias, the most recent snap, and the composite bias.
I use this as a tape-reading and reaction aid around pullbacks, failed pushes, VWAP tests, prior swing levels, and local reversal attempts. It is not a standalone buy/sell system. Strong trend days can produce countertrend wick signals that fail, so the best use is as a confirmation layer alongside market structure, trend, liquidity context, and risk controls.
Key inputs include QStick length, Force Index length, Ulcer Index length, wick/body threshold, signal cooldown, marker offset, dashboard visibility, and palette colors. Lower wick thresholds create more signals. Higher thresholds demand more obvious rejection and reduce signal frequency.
Open-source [ZOM] script for educational use only. Not financial advice.
开源脚本
秉承TradingView的精神,该脚本的作者将其开源,以便交易者可以查看和验证其功能。向作者致敬!您可以免费使用该脚本,但请记住,重新发布代码须遵守我们的网站规则。

免责声明
这些信息和出版物并非旨在提供,也不构成TradingView提供或认可的任何形式的财务、投资、交易或其他类型的建议或推荐。请阅读使用条款了解更多信息。
免责声明
这些信息和出版物并非旨在提供,也不构成TradingView提供或认可的任何形式的财务、投资、交易或其他类型的建议或推荐。请阅读使用条款了解更多信息。