Compression Box + Breakout Plan [Rider Algo]
Compression Box + Breakout Plan [Rider Algo]
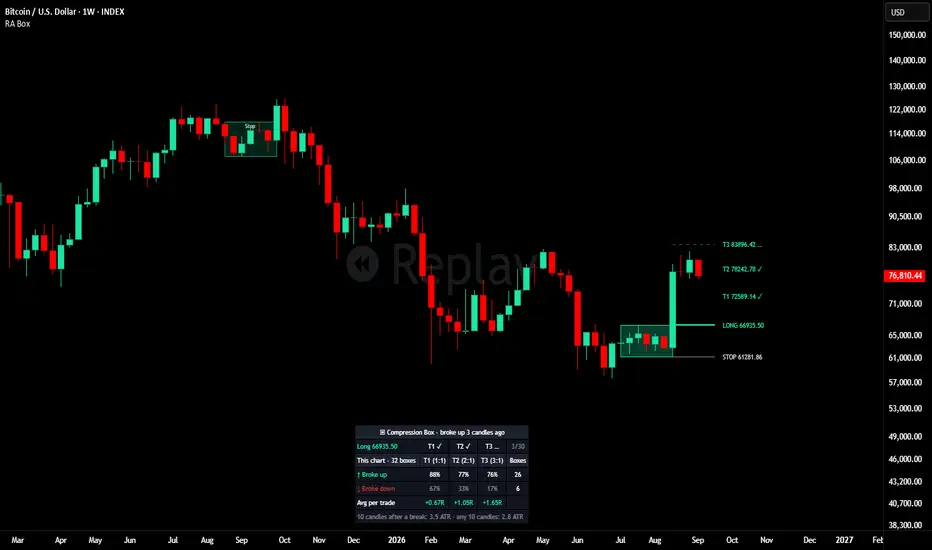
Compression Box draws a box when price goes unusually quiet and turns it into a ready-made plan: a buy stop at the top, a sell stop at the bottom, a stop on the other side and three targets. Think of the box as a narrow doorway: price can leave through either side, and the narrower the doorway, the less you risk if you picked the wrong one. A table replays every past box on your chart with the same rules, so you can see how this plan has actually played out on the symbol and timeframe you trade.
═══════════════════════════════════════════════════════════════════════════
HOW IT WORKS
1. The box forms when the last 5 candles fit inside a range no taller than 1 ATR 50, meaning the last five candles together moved no more than one normal candle of this asset. Its top and bottom are fixed at the close of that candle. Up to the daily timeframe the height is compared in price; on weekly and monthly charts it is compared in % of price, because over 50 weekly candles price can double and an ATR measured in price would lag behind a strong trend.
2. The box lives while price trades inside it. The first candle that trades beyond an edge releases it.
3. The plan is a buy stop at the top and a sell stop at the bottom, placed in advance. The order that fills is the trade. Its stop is the other side of the box, and the targets sit 1, 2 and 3 box heights beyond the entry edge, so T1, T2 and T3 are 1:1, 2:1 and 3:1 reward to risk.
4. The replay: every past box of the chart is traded with the same rules, commission included, and the results are summarized in the table.
The indicator does not guess the direction of the break. Both sides are planned and reported separately.
═══════════════════════════════════════════════════════════════════════════
WHAT YOU SEE ON THE CHART
The live box (yellow)
Labelled QUIET with the number of candles it has lasted. To the right of the last candle: the BUY STOP and SELL STOP prices and the dotted T1, T2 and T3 levels for each side. This is the plan before the break, the moment traders commonly use to place both orders and size the position from the box height.
The trade after the break
The box takes the color of the side that broke. The entry line, the stop line and the dashed targets are tracked candle by candle and marked ✓ (target reached), ✗ (stop) or ⌛ (closed by time). While the trade is open, its prices are shown to the right of the last candle. Once it is closed, the lines stay where each level was hit and the prices on the right disappear, so a finished trade never looks active.
Past boxes (optional)
Turn on Show past boxes to draw the latest boxes of the chart, colored by the side that broke, with the best result each one reached: T1, T2, T3, Stop or Time. Gray means both edges were touched in the same candle.
The table: how this plan did on THIS chart
- The header tells you whether price is quiet right now, how many candles ago the latest trade broke, or, when there is no box, how many candles ago the last one broke.
- Box and Height: how long the live box has lasted and how tall it is (in % of price and in ATR), compared with the past boxes of the chart.
- Orders: buy stop and sell stop, with the stop and targets of each side in the tooltip.
- Long / Short: the status of the latest trade and the candles left before it is closed by time.
- Broke up / Broke down: for each side, how often T1, T2 and T3 were reached before the stop. Values in gray come from fewer than 20 trades and are not reliable.
- Avg per trade: the average result per trade in R (1R = the box height you risk), after commission, for each target. Above zero means the plan made money on this chart; below zero means it lost. Boxes that touched both edges in one candle are counted as losses.
- 10 candles after a break vs any 10 candles: the median range after a break compared with any stretch of the chart, both in ATR.
The last line is worth reading: a quiet market does not usually explode. On most charts the move after a box is no bigger than a normal move. What the box gives you is a small stop, so targets measured in box heights are within reach more often. The table shows whether that holds on your chart, and on some charts and timeframes it does not: that is exactly why the replay is there.
═══════════════════════════════════════════════════════════════════════════
HOW TO USE IT
1. Read the table first. If Avg per trade is below zero, or the counts are in gray, the plan has not worked or has too little history on this chart and timeframe.
2. Pick the target whose average result fits your style: T1 is reached more often, T3 pays more when it is reached.
3. When a yellow box appears, the buy stop, the sell stop and the stop of each side are already drawn. The box height is your risk per trade.
4. After the break, follow the trade on the chart and in the table until a target, the stop or the time limit.
Combine it with your own trend or context tool: the box tells you where the risk is small, not which way price will go.
═══════════════════════════════════════════════════════════════════════════
INPUTS
1 · Compression box
- Minimum candles (default 5): how many candles must fit inside the range.
- Maximum height (× ATR) (default 1.0): how tall the range can be, in ATR 50. Lower = rarer and tighter boxes. On 1D charts the defaults give about one box every 65 candles.
- Height measured in (default Auto): Price, Percent, or Auto, which uses price up to 1D and % of price on weekly and monthly charts.
2 · Breakout plan
- Draw the plan: show or hide the orders, the trade and the targets.
- Targets (× box height) (defaults 1, 2 and 3).
- Max candles in a trade (default 30): after this many candles without a target or the stop, the trade is closed at that candle's close.
- Commission per side (%) (default 0.1): charged on the entry and on the exit in the table's results.
3 · Display
- Colors of the box and of each side, Color candles inside a box, and Show past boxes with how many to draw (default 20).
4 · Table
- Content: Compact, or Full to add the boxes that touched both edges, the typical box and the rules used. Position and Size.
═══════════════════════════════════════════════════════════════════════════
BUILT-IN ALERTS
- Compression box formed: a new box closed. With "Any alert() function call", the message includes the buy stop, the sell stop and the risk in %.
- Broke up / Broke down: price left the box on that side. With "Any alert() function call", the message includes the entry, the stop, T1 and T2.
The Data Window also shows Box candles, Box height %, Buy stop and Sell stop while a box is alive, which helps find symbols that are currently in compression.
═══════════════════════════════════════════════════════════════════════════
TECHNICAL NOTES
- Pine Script v6.
- A box forms only at the close of a candle and its edges never move afterwards. The break is detected as soon as price trades beyond an edge, also on the live candle.
- Conservative counting in the replay: if a candle touches the stop and a target, it counts as the stop; if a candle touches both edges of the box, it is a loss; if price opens beyond the stop, the exit is at the open; if price opens beyond the edge, the entry is at the open.
- A box must also be at least 10 ticks tall, so flat candles in very old history (for example, Bitcoin trading at cents) do not create boxes with no risk to measure. The first 100 candles are skipped while the ATR warms up.
- The results use all the history loaded on the chart, so they can differ slightly between data sources of the same asset.
- Boxes are rare on weekly charts. A strongly trending asset can go years without five quiet weeks; the header then shows how long ago the last box broke. Raising Maximum height gives more boxes, looser ones, and the table shows whether the plan still held with them.
- The box is drawn from price range and ATR only. It does not use Bollinger Bands, Keltner Channels or any third-party code.
═══════════════════════════════════════════════════════════════════════════
PART OF THE RIDER ALGO ECOSYSTEM
- Use with Rider Algo - Volatility Regime Detector: boxes are the price-level view of a Compression regime, with exact orders, stop and targets.
- Use with Probability Clouds + Entry Level [Rider Algo] to check whether T1, T2 or T3 sit inside the range price usually covers in the next few candles.
- Use with Macro BTC - for Holders [Rider Algo] or Macro ADA - for Holders [Rider Algo] for the long-term context in which a break happens.
═══════════════════════════════════════════════════════════════════════════
DISCLAIMER
This indicator is a technical analysis tool designed to mark low-volatility ranges, plan the orders at their edges and show how that plan played out on a chart's own history. It does NOT provide buy or sell signals, and it does NOT constitute financial, investment, or trading advice of any kind. Past performance does not guarantee future market behavior. Always conduct your own analysis and consult with a qualified financial advisor before making any trading decisions. Use this tool at your own risk. The author is not responsible for any financial losses incurred from the use of this indicator.
Compression Box draws a box when price goes unusually quiet and turns it into a ready-made plan: a buy stop at the top, a sell stop at the bottom, a stop on the other side and three targets. Think of the box as a narrow doorway: price can leave through either side, and the narrower the doorway, the less you risk if you picked the wrong one. A table replays every past box on your chart with the same rules, so you can see how this plan has actually played out on the symbol and timeframe you trade.
═══════════════════════════════════════════════════════════════════════════
HOW IT WORKS
1. The box forms when the last 5 candles fit inside a range no taller than 1 ATR 50, meaning the last five candles together moved no more than one normal candle of this asset. Its top and bottom are fixed at the close of that candle. Up to the daily timeframe the height is compared in price; on weekly and monthly charts it is compared in % of price, because over 50 weekly candles price can double and an ATR measured in price would lag behind a strong trend.
2. The box lives while price trades inside it. The first candle that trades beyond an edge releases it.
3. The plan is a buy stop at the top and a sell stop at the bottom, placed in advance. The order that fills is the trade. Its stop is the other side of the box, and the targets sit 1, 2 and 3 box heights beyond the entry edge, so T1, T2 and T3 are 1:1, 2:1 and 3:1 reward to risk.
4. The replay: every past box of the chart is traded with the same rules, commission included, and the results are summarized in the table.
The indicator does not guess the direction of the break. Both sides are planned and reported separately.
═══════════════════════════════════════════════════════════════════════════
WHAT YOU SEE ON THE CHART
The live box (yellow)
Labelled QUIET with the number of candles it has lasted. To the right of the last candle: the BUY STOP and SELL STOP prices and the dotted T1, T2 and T3 levels for each side. This is the plan before the break, the moment traders commonly use to place both orders and size the position from the box height.
The trade after the break
The box takes the color of the side that broke. The entry line, the stop line and the dashed targets are tracked candle by candle and marked ✓ (target reached), ✗ (stop) or ⌛ (closed by time). While the trade is open, its prices are shown to the right of the last candle. Once it is closed, the lines stay where each level was hit and the prices on the right disappear, so a finished trade never looks active.
Past boxes (optional)
Turn on Show past boxes to draw the latest boxes of the chart, colored by the side that broke, with the best result each one reached: T1, T2, T3, Stop or Time. Gray means both edges were touched in the same candle.
The table: how this plan did on THIS chart
- The header tells you whether price is quiet right now, how many candles ago the latest trade broke, or, when there is no box, how many candles ago the last one broke.
- Box and Height: how long the live box has lasted and how tall it is (in % of price and in ATR), compared with the past boxes of the chart.
- Orders: buy stop and sell stop, with the stop and targets of each side in the tooltip.
- Long / Short: the status of the latest trade and the candles left before it is closed by time.
- Broke up / Broke down: for each side, how often T1, T2 and T3 were reached before the stop. Values in gray come from fewer than 20 trades and are not reliable.
- Avg per trade: the average result per trade in R (1R = the box height you risk), after commission, for each target. Above zero means the plan made money on this chart; below zero means it lost. Boxes that touched both edges in one candle are counted as losses.
- 10 candles after a break vs any 10 candles: the median range after a break compared with any stretch of the chart, both in ATR.
The last line is worth reading: a quiet market does not usually explode. On most charts the move after a box is no bigger than a normal move. What the box gives you is a small stop, so targets measured in box heights are within reach more often. The table shows whether that holds on your chart, and on some charts and timeframes it does not: that is exactly why the replay is there.
═══════════════════════════════════════════════════════════════════════════
HOW TO USE IT
1. Read the table first. If Avg per trade is below zero, or the counts are in gray, the plan has not worked or has too little history on this chart and timeframe.
2. Pick the target whose average result fits your style: T1 is reached more often, T3 pays more when it is reached.
3. When a yellow box appears, the buy stop, the sell stop and the stop of each side are already drawn. The box height is your risk per trade.
4. After the break, follow the trade on the chart and in the table until a target, the stop or the time limit.
Combine it with your own trend or context tool: the box tells you where the risk is small, not which way price will go.
═══════════════════════════════════════════════════════════════════════════
INPUTS
1 · Compression box
- Minimum candles (default 5): how many candles must fit inside the range.
- Maximum height (× ATR) (default 1.0): how tall the range can be, in ATR 50. Lower = rarer and tighter boxes. On 1D charts the defaults give about one box every 65 candles.
- Height measured in (default Auto): Price, Percent, or Auto, which uses price up to 1D and % of price on weekly and monthly charts.
2 · Breakout plan
- Draw the plan: show or hide the orders, the trade and the targets.
- Targets (× box height) (defaults 1, 2 and 3).
- Max candles in a trade (default 30): after this many candles without a target or the stop, the trade is closed at that candle's close.
- Commission per side (%) (default 0.1): charged on the entry and on the exit in the table's results.
3 · Display
- Colors of the box and of each side, Color candles inside a box, and Show past boxes with how many to draw (default 20).
4 · Table
- Content: Compact, or Full to add the boxes that touched both edges, the typical box and the rules used. Position and Size.
═══════════════════════════════════════════════════════════════════════════
BUILT-IN ALERTS
- Compression box formed: a new box closed. With "Any alert() function call", the message includes the buy stop, the sell stop and the risk in %.
- Broke up / Broke down: price left the box on that side. With "Any alert() function call", the message includes the entry, the stop, T1 and T2.
The Data Window also shows Box candles, Box height %, Buy stop and Sell stop while a box is alive, which helps find symbols that are currently in compression.
═══════════════════════════════════════════════════════════════════════════
TECHNICAL NOTES
- Pine Script v6.
- A box forms only at the close of a candle and its edges never move afterwards. The break is detected as soon as price trades beyond an edge, also on the live candle.
- Conservative counting in the replay: if a candle touches the stop and a target, it counts as the stop; if a candle touches both edges of the box, it is a loss; if price opens beyond the stop, the exit is at the open; if price opens beyond the edge, the entry is at the open.
- A box must also be at least 10 ticks tall, so flat candles in very old history (for example, Bitcoin trading at cents) do not create boxes with no risk to measure. The first 100 candles are skipped while the ATR warms up.
- The results use all the history loaded on the chart, so they can differ slightly between data sources of the same asset.
- Boxes are rare on weekly charts. A strongly trending asset can go years without five quiet weeks; the header then shows how long ago the last box broke. Raising Maximum height gives more boxes, looser ones, and the table shows whether the plan still held with them.
- The box is drawn from price range and ATR only. It does not use Bollinger Bands, Keltner Channels or any third-party code.
═══════════════════════════════════════════════════════════════════════════
PART OF THE RIDER ALGO ECOSYSTEM
- Use with Rider Algo - Volatility Regime Detector: boxes are the price-level view of a Compression regime, with exact orders, stop and targets.
- Use with Probability Clouds + Entry Level [Rider Algo] to check whether T1, T2 or T3 sit inside the range price usually covers in the next few candles.
- Use with Macro BTC - for Holders [Rider Algo] or Macro ADA - for Holders [Rider Algo] for the long-term context in which a break happens.
═══════════════════════════════════════════════════════════════════════════
DISCLAIMER
This indicator is a technical analysis tool designed to mark low-volatility ranges, plan the orders at their edges and show how that plan played out on a chart's own history. It does NOT provide buy or sell signals, and it does NOT constitute financial, investment, or trading advice of any kind. Past performance does not guarantee future market behavior. Always conduct your own analysis and consult with a qualified financial advisor before making any trading decisions. Use this tool at your own risk. The author is not responsible for any financial losses incurred from the use of this indicator.

Trend first. No fear, no FOMO: just a plan and execution.
— Rider Algo (Scripts tab on my profile)
Not financial advice.
— Rider Algo (Scripts tab on my profile)
Not financial advice.
免责声明
这些信息和出版物并非旨在提供,也不构成TradingView提供或认可的任何形式的财务、投资、交易或其他类型的建议或推荐。请阅读使用条款了解更多信息。
Trend first. No fear, no FOMO: just a plan and execution.
— Rider Algo (Scripts tab on my profile)
Not financial advice.
— Rider Algo (Scripts tab on my profile)
Not financial advice.
免责声明
这些信息和出版物并非旨在提供,也不构成TradingView提供或认可的任何形式的财务、投资、交易或其他类型的建议或推荐。请阅读使用条款了解更多信息。