INVITE-ONLY SCRIPT
Monte Carlo [NeuralMarkets]
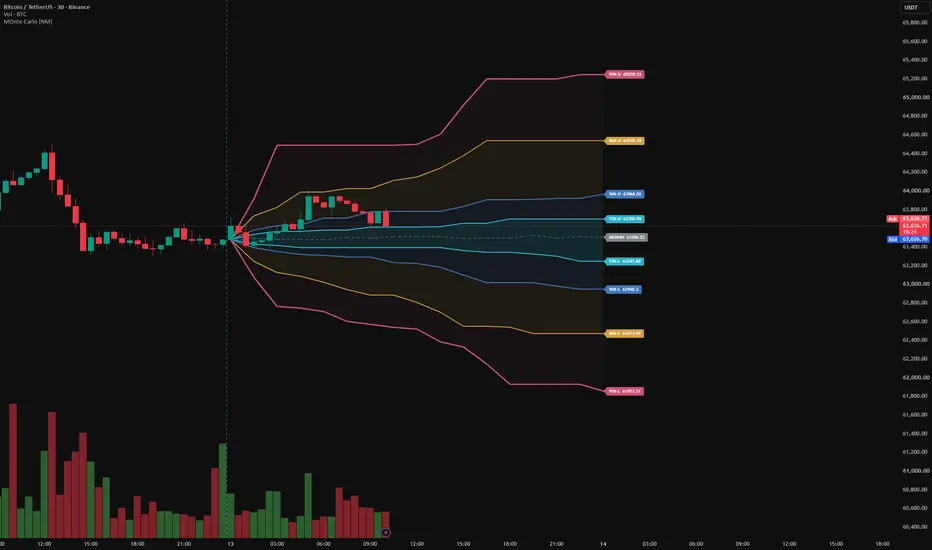
MONTE CARLO [NEURALMARKETS]
Monte Carlo [NeuralMarkets] creates a forward probability map of potential price movement for the selected time horizon.
Instead of reacting to price after a move has occurred, the indicator establishes its expected ranges at the beginning of the period and allows traders to compare actual price movement against those expectations as the period develops.
The central question is simple:
Is the move happening right now normal for this point in time, or is the market moving into statistically unusual territory?
NON-REPAINTING FORWARD PROJECTION
A key feature of Monte Carlo is that the active projection is established at the beginning of the selected period.
For a Day horizon, the expected ranges are generated at the beginning of the trading session.
For a Week horizon, they are established at the beginning of the week.
The same principle applies to Month, 3 Months, 6 Months and 1 Year.
This means the indicator does not repaint its active projection to make historical price action appear better aligned with the model.
If price reaches an 80% or 95% range later in the period, that range was projected before the move occurred.
This allows realized market movement to be evaluated against an expectation that existed in advance.
THE MONTE CARLO RANGES: The indicator displays four probability ranges:
25% Range
50% Range
80% Range
95% Range
These represent progressively wider portions of the simulated price distribution.
The ranges should not be interpreted as traditional support and resistance levels. They describe how unusual the magnitude of a price move is becoming relative to the Monte Carlo distribution.
25% RANGE — CORE MOVEMENT

The 25% range represents the central portion of the simulated distribution.
Price remaining within this area indicates relatively contained movement around the period anchor.
Movement outside the 25% range is the first indication that price is beginning to move beyond the core portion of simulated outcomes.
50% RANGE — NORMAL EXPANSION

The 50% range represents a broader area of the simulated distribution.
Movement between the 25% and 50% ranges can generally be viewed as normal expansion.
Price is moving, but the magnitude of the move is not yet statistically exceptional.
80% RANGE — SIGNIFICANT EXPANSION

Movement toward or beyond the 80% range indicates that price has entered a less common part of the simulated distribution.
This can occur during strong directional sessions, accelerating volatility, macro repricing or persistent buying or selling.
An 80% range break does not automatically mean that price should reverse.
It means the magnitude of the move has become significantly less common relative to the original Monte Carlo projection.
95% RANGE — STATISTICAL EXTREME

The 95% range represents the outer region of the simulated distribution.
Price reaching or exceeding this area indicates an unusually large move relative to the expectation established at the beginning of the period.
These moves may occur during major news events, volatility shocks, strong trend acceleration or other exceptional market conditions.
A 95% reading should not automatically be interpreted as overbought or oversold.
It means something more specific:
The magnitude of the move has become statistically unusual.
TIME MATTERS
A major difference between Monte Carlo ranges and conventional fixed price bands is that expected movement changes with time.
A 1% move shortly after the market opens can have a very different statistical meaning from the same 1% move near the end of the session.
The Monte Carlo ranges expand through the selected period to account for this.
The indicator therefore evaluates both distance and time.
Instead of asking only: How far has price moved?
Monte Carlo allows the trader to ask: How far has price moved compared with what was expected by this point in time?
MONTE CARLO MEDIAN
The center line represents the median outcome of the simulated distribution.
It is not a moving average and it is not a price target.
During directional markets, price can remain above or below the Monte Carlo Median for extended periods.
PERIOD ANCHOR
Every Monte Carlo projection begins from a defined period anchor.
Available horizons are:
For intraday use, First Candle Open is the recommended anchor setting.
READING VOLATILITY EXPANSION
One useful way to interpret the indicator is to observe how price progresses through the probability ranges.
For example: 25% → 50% → 80% → 95%
This represents progressively greater expansion away from the central portion of the original simulated distribution.
A market progressing rapidly through these ranges is behaving very differently from one that spends most of the period inside the 25% or 50% ranges.
This makes the indicator useful for distinguishing ordinary price movement from genuine volatility expansion.
READING RE-ENTRY
Price can also move outside a Monte Carlo range and subsequently return inside it.
This is called re-entry.
For example, if price moves beyond the 95% range and later closes back inside it, the extreme expansion has begun to normalize.
Re-entry does not automatically indicate a reversal.
It simply means price has returned to a less extreme portion of the simulated distribution.
ALERTS
Monte Carlo includes alerts for expansion and re-entry across the 25%, 50%, 80% and 95% ranges.
The 95% alerts identify statistical extremes.
A separate Any Monte Carlo Level Cross alert can monitor crossings of the major probability ranges, Monte Carlo Median and period anchor.
Alerts are evaluated using confirmed candle closes and include a buffer designed to reduce repeated notifications when price oscillates around the same boundary.
MULTIPLE TIME HORIZONS
The same price movement can have very different meanings across different horizons.
A move may be statistically extreme relative to today's expected distribution while remaining completely normal within the weekly distribution.
Likewise, a large weekly move may still remain comfortably inside the monthly projection.
The available horizons allow Monte Carlo to be used for intraday, swing and longer-term market analysis.
CROSS-MARKET APPLICATION
Monte Carlo is designed to adapt to markets with very different price scales and volatility characteristics.
Examples shown using:
SPY

Nasdaq Futures (NQ)

Bitcoin (BTC)

USDJPY

Gold/Silver

Crude

Rather than relying on the same fixed number of points or percentage movement across every market, the indicator evaluates movement relative to the behavior and volatility of the instrument being analyzed.
THE CORE IDEA
Know the probabilities and expected ranges before the move happens. Monte Carlo gives traders a predefined map of where normal movement ends and where significant or extreme expansion begins — before price gets there.
That changes the trading process.
Instead of reacting to every sudden candle, chasing a breakout, or panicking when price accelerates, traders can plan in advance:
Where is movement still normal?
The objective is simple:
Plan the trade before the market forces a decision.
Less chasing. Less panic. Fewer knee-jerk trades.
More preparation, better-defined risk and more disciplined execution.
Monte Carlo indicator provides the probability framework to help traders make more deliberate decisions when the market starts moving.
Monte Carlo [NeuralMarkets] creates a forward probability map of potential price movement for the selected time horizon.
Instead of reacting to price after a move has occurred, the indicator establishes its expected ranges at the beginning of the period and allows traders to compare actual price movement against those expectations as the period develops.
The central question is simple:
Is the move happening right now normal for this point in time, or is the market moving into statistically unusual territory?
NON-REPAINTING FORWARD PROJECTION
A key feature of Monte Carlo is that the active projection is established at the beginning of the selected period.
For a Day horizon, the expected ranges are generated at the beginning of the trading session.
For a Week horizon, they are established at the beginning of the week.
The same principle applies to Month, 3 Months, 6 Months and 1 Year.
Once the simulation inputs for the active period are locked, subsequent price movement does not cause the ranges to continuously recalculate around price.
This means the indicator does not repaint its active projection to make historical price action appear better aligned with the model.
If price reaches an 80% or 95% range later in the period, that range was projected before the move occurred.
This allows realized market movement to be evaluated against an expectation that existed in advance.
THE MONTE CARLO RANGES: The indicator displays four probability ranges:
25% Range
50% Range
80% Range
95% Range
These represent progressively wider portions of the simulated price distribution.
The ranges should not be interpreted as traditional support and resistance levels. They describe how unusual the magnitude of a price move is becoming relative to the Monte Carlo distribution.
25% RANGE — CORE MOVEMENT
The 25% range represents the central portion of the simulated distribution.
Price remaining within this area indicates relatively contained movement around the period anchor.
Movement outside the 25% range is the first indication that price is beginning to move beyond the core portion of simulated outcomes.
50% RANGE — NORMAL EXPANSION
The 50% range represents a broader area of the simulated distribution.
Movement between the 25% and 50% ranges can generally be viewed as normal expansion.
Price is moving, but the magnitude of the move is not yet statistically exceptional.
80% RANGE — SIGNIFICANT EXPANSION
Movement toward or beyond the 80% range indicates that price has entered a less common part of the simulated distribution.
This can occur during strong directional sessions, accelerating volatility, macro repricing or persistent buying or selling.
An 80% range break does not automatically mean that price should reverse.
It means the magnitude of the move has become significantly less common relative to the original Monte Carlo projection.
95% RANGE — STATISTICAL EXTREME
The 95% range represents the outer region of the simulated distribution.
Price reaching or exceeding this area indicates an unusually large move relative to the expectation established at the beginning of the period.
These moves may occur during major news events, volatility shocks, strong trend acceleration or other exceptional market conditions.
A 95% reading should not automatically be interpreted as overbought or oversold.
It means something more specific:
The magnitude of the move has become statistically unusual.
TIME MATTERS
A major difference between Monte Carlo ranges and conventional fixed price bands is that expected movement changes with time.
A 1% move shortly after the market opens can have a very different statistical meaning from the same 1% move near the end of the session.
The Monte Carlo ranges expand through the selected period to account for this.
The indicator therefore evaluates both distance and time.
Instead of asking only: How far has price moved?
Monte Carlo allows the trader to ask: How far has price moved compared with what was expected by this point in time?
MONTE CARLO MEDIAN
The center line represents the median outcome of the simulated distribution.
It is not a moving average and it is not a price target.
During directional markets, price can remain above or below the Monte Carlo Median for extended periods.
PERIOD ANCHOR
Every Monte Carlo projection begins from a defined period anchor.
Available horizons are:
- Day
- Week
- Month
- 3 Months
- 6 Months
- 1 Year
For intraday use, First Candle Open is the recommended anchor setting.
READING VOLATILITY EXPANSION
One useful way to interpret the indicator is to observe how price progresses through the probability ranges.
For example: 25% → 50% → 80% → 95%
This represents progressively greater expansion away from the central portion of the original simulated distribution.
A market progressing rapidly through these ranges is behaving very differently from one that spends most of the period inside the 25% or 50% ranges.
This makes the indicator useful for distinguishing ordinary price movement from genuine volatility expansion.
READING RE-ENTRY
Price can also move outside a Monte Carlo range and subsequently return inside it.
This is called re-entry.
For example, if price moves beyond the 95% range and later closes back inside it, the extreme expansion has begun to normalize.
Re-entry does not automatically indicate a reversal.
It simply means price has returned to a less extreme portion of the simulated distribution.
ALERTS
Monte Carlo includes alerts for expansion and re-entry across the 25%, 50%, 80% and 95% ranges.
The 95% alerts identify statistical extremes.
A separate Any Monte Carlo Level Cross alert can monitor crossings of the major probability ranges, Monte Carlo Median and period anchor.
Alerts are evaluated using confirmed candle closes and include a buffer designed to reduce repeated notifications when price oscillates around the same boundary.
MULTIPLE TIME HORIZONS
The same price movement can have very different meanings across different horizons.
A move may be statistically extreme relative to today's expected distribution while remaining completely normal within the weekly distribution.
Likewise, a large weekly move may still remain comfortably inside the monthly projection.
The available horizons allow Monte Carlo to be used for intraday, swing and longer-term market analysis.
CROSS-MARKET APPLICATION
Monte Carlo is designed to adapt to markets with very different price scales and volatility characteristics.
Examples shown using:
SPY
Nasdaq Futures (NQ)
Bitcoin (BTC)
USDJPY
Gold/Silver
Crude
Rather than relying on the same fixed number of points or percentage movement across every market, the indicator evaluates movement relative to the behavior and volatility of the instrument being analyzed.
THE CORE IDEA
Know the probabilities and expected ranges before the move happens. Monte Carlo gives traders a predefined map of where normal movement ends and where significant or extreme expansion begins — before price gets there.
That changes the trading process.
Instead of reacting to every sudden candle, chasing a breakout, or panicking when price accelerates, traders can plan in advance:
Where is movement still normal?
- Where does meaningful expansion begin?
- Where is price entering statistically unusual territory?
- Where should I become more selective, take profits, reduce risk or wait for confirmation?
The objective is simple:
Plan the trade before the market forces a decision.
Less chasing. Less panic. Fewer knee-jerk trades.
More preparation, better-defined risk and more disciplined execution.
Monte Carlo indicator provides the probability framework to help traders make more deliberate decisions when the market starts moving.
仅限邀请脚本
只有作者授权的用户才能访问此脚本。您需要申请并获得使用许可。通常情况下,付款后即可获得许可。更多详情,请按照下方作者的说明操作,或直接联系NeuralMarkets。
TradingView不建议您付费购买或使用任何脚本,除非您完全信任其作者并了解其工作原理。您也可以在我们的社区脚本找到免费的开源替代方案。
作者的说明
To avail FREE TRIAL, please send me a direct message

Machine-learning market structure & forecast levels. Publishing levels before the markets move. Educational only.
免责声明
这些信息和出版物并非旨在提供,也不构成TradingView提供或认可的任何形式的财务、投资、交易或其他类型的建议或推荐。请阅读使用条款了解更多信息。
仅限邀请脚本
只有作者授权的用户才能访问此脚本。您需要申请并获得使用许可。通常情况下,付款后即可获得许可。更多详情,请按照下方作者的说明操作,或直接联系NeuralMarkets。
TradingView不建议您付费购买或使用任何脚本,除非您完全信任其作者并了解其工作原理。您也可以在我们的社区脚本找到免费的开源替代方案。
作者的说明
To avail FREE TRIAL, please send me a direct message
Machine-learning market structure & forecast levels. Publishing levels before the markets move. Educational only.
免责声明
这些信息和出版物并非旨在提供,也不构成TradingView提供或认可的任何形式的财务、投资、交易或其他类型的建议或推荐。请阅读使用条款了解更多信息。