OPEN-SOURCE SCRIPT
已更新 Liquidity Levels.
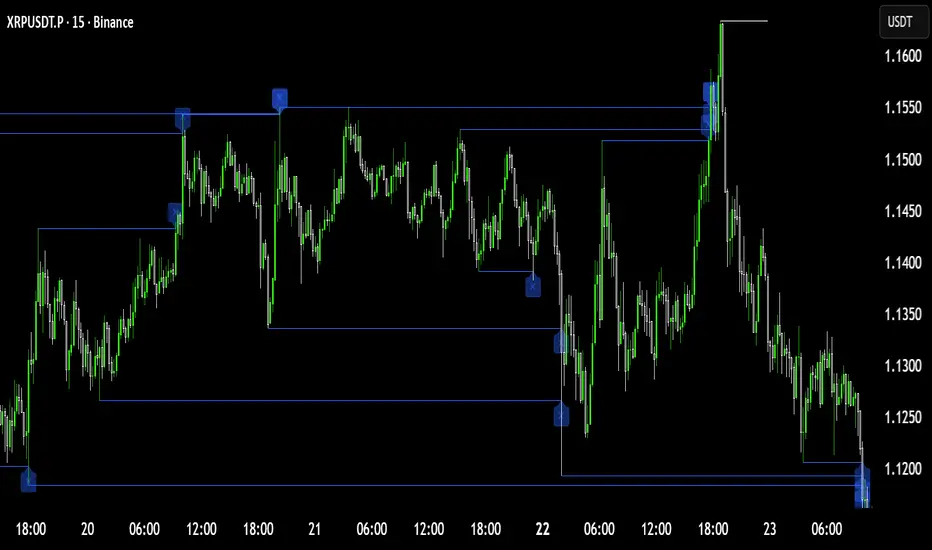
OVERVIEW
This indicator marks resting liquidity on the chart by drawing horizontal lines at confirmed swing highs and swing lows. In price-action and Smart Money concepts, swing highs tend to hold buy-side liquidity (buy stops from breakout buyers and short-sellers' protective stops), while swing lows tend to hold sell-side liquidity (sell stops). Visualising these levels helps traders see where orders are likely resting and where price may be drawn before continuing or reversing.
HOW IT WORKS
The script uses pivot detection to identify swing points. A swing high is confirmed when a candle's high is higher than the highs of the surrounding bars on both sides; a swing low is confirmed when a candle's low is lower than the lows of the surrounding bars on both sides. The number of bars required on each side is controlled by the Swing Lookback input. Because a pivot needs bars on both sides to confirm, levels print after the lookback period has elapsed — they do not repaint once drawn.
Each confirmed swing plots a dashed line at that price. Lines can optionally extend to the right so you can track whether a level remains untapped on the current candle.
INPUTS
- Swing Lookback: bars required on each side of a pivot. Higher values isolate more significant swing points and reduce minor levels.
- Show Buy-Side Liquidity (highs): toggles swing-high lines.
- Show Sell-Side Liquidity (lows): toggles swing-low lines.
- Extend Lines Right: extends levels forward for easier tracking.
- Liquidity Line Color and Line Width: visual styling.
HOW TO USE
- Raise the Swing Lookback on higher timeframes to focus on major liquidity; lower it on intraday charts for finer levels.
- Watch for price reaching an untapped level. A sweep (price piercing the level then closing back) can signal that liquidity has been taken, which some traders use as a reversal cue when combined with their own confirmation.
- This tool only maps levels. It does not generate entries, targets, or signals, and is best combined with your own market-structure or confirmation method.
NOTES
This is a visualisation tool, not a trading system, and does not constitute financial advice. Test any approach on your own before applying it to live decisions.
This indicator marks resting liquidity on the chart by drawing horizontal lines at confirmed swing highs and swing lows. In price-action and Smart Money concepts, swing highs tend to hold buy-side liquidity (buy stops from breakout buyers and short-sellers' protective stops), while swing lows tend to hold sell-side liquidity (sell stops). Visualising these levels helps traders see where orders are likely resting and where price may be drawn before continuing or reversing.
HOW IT WORKS
The script uses pivot detection to identify swing points. A swing high is confirmed when a candle's high is higher than the highs of the surrounding bars on both sides; a swing low is confirmed when a candle's low is lower than the lows of the surrounding bars on both sides. The number of bars required on each side is controlled by the Swing Lookback input. Because a pivot needs bars on both sides to confirm, levels print after the lookback period has elapsed — they do not repaint once drawn.
Each confirmed swing plots a dashed line at that price. Lines can optionally extend to the right so you can track whether a level remains untapped on the current candle.
INPUTS
- Swing Lookback: bars required on each side of a pivot. Higher values isolate more significant swing points and reduce minor levels.
- Show Buy-Side Liquidity (highs): toggles swing-high lines.
- Show Sell-Side Liquidity (lows): toggles swing-low lines.
- Extend Lines Right: extends levels forward for easier tracking.
- Liquidity Line Color and Line Width: visual styling.
HOW TO USE
- Raise the Swing Lookback on higher timeframes to focus on major liquidity; lower it on intraday charts for finer levels.
- Watch for price reaching an untapped level. A sweep (price piercing the level then closing back) can signal that liquidity has been taken, which some traders use as a reversal cue when combined with their own confirmation.
- This tool only maps levels. It does not generate entries, targets, or signals, and is best combined with your own market-structure or confirmation method.
NOTES
This is a visualisation tool, not a trading system, and does not constitute financial advice. Test any approach on your own before applying it to live decisions.
版本注释
OVERVIEWThis indicator maps resting liquidity by drawing lines at confirmed swing highs and swing lows, then actively tracks whether each level has been swept. Unswept levels — where orders are still likely resting — are highlighted prominently. Once price takes a level, the line automatically restyles to a muted "swept" state and can freeze at the exact candle that took it. The result is a clean, at-a-glance map of which liquidity is still live and which has already been consumed.
In price-action and Smart Money concepts, swing highs tend to hold buy-side liquidity (buy stops from breakout buyers and short-sellers' protective stops) and swing lows tend to hold sell-side liquidity (sell stops). Seeing which of these pools remain untapped helps traders anticipate where price may be drawn.
HOW IT WORKS
Swing points are found with pivot detection: a swing high is confirmed when a bar's high exceeds the highs of the surrounding bars on both sides, and a swing low when a bar's low is below the lows on both sides. The Swing Lookback input sets how many bars are required on each side. Because confirmation needs bars on both sides, levels print after the lookback elapses and do not repaint once drawn.
Each confirmed swing is stored and monitored on every bar. A level is flagged as swept when price interacts with it according to the Sweep Trigger setting:
- Wick: the level counts as swept the moment price pierces it (including intrabar).
- Close: the level is only swept once a candle closes through it (more conservative).
When a level is swept, its line is restyled using the separate Swept Style settings, optionally frozen at the sweeping candle, and optionally marked with a small label. Unswept levels keep the prominent Unswept Style. A per-side cap keeps only the most recent levels so the chart stays readable.
INPUTS
Detection
- Swing Lookback: bars required on each side of a pivot. Higher values isolate more significant swings.
- Max Levels Per Side: how many recent highs and lows to keep tracking.
Visibility
- Show Buy-Side / Sell-Side Liquidity: toggle highs and lows independently.
- Show Unswept / Show Swept Levels: show or hide each state.
- Extend Unswept Lines Right: project live levels forward.
Sweep Logic
- Sweep Trigger: Wick or Close, as described above.
- Stop Line at Sweep Candle: freeze a swept line at the candle that took it.
- Mark Sweep with Label: place a small marker at the sweep point.
Unswept Style / Swept Style
- Independent color, width, and line-style controls for each state, so live and consumed liquidity are visually distinct.
HOW TO USE
- Increase Swing Lookback on higher timeframes to focus on major liquidity; lower it intraday for finer levels.
- Treat bright unswept levels as areas where liquidity is still resting. Watch how price reacts as it approaches them.
- A sweep — price piercing a level then reacting — is used by many traders as a potential reversal or continuation cue when combined with their own confirmation method (market structure shift, candle confirmation, etc.).
- Use the Close trigger if you prefer to ignore intrabar wicks and only register sweeps on closed candles.
NOTES
This is a visualisation tool, not a trading system. It does not generate entries, targets, or signals, and it does not constitute financial advice. Always validate any approach with your own testing before using it in live decisions.
开源脚本
秉承TradingView的精神,该脚本的作者将其开源,以便交易者可以查看和验证其功能。向作者致敬!您可以免费使用该脚本,但请记住,重新发布代码须遵守我们的网站规则。

免责声明
这些信息和出版物并非旨在提供,也不构成TradingView提供或认可的任何形式的财务、投资、交易或其他类型的建议或推荐。请阅读使用条款了解更多信息。
开源脚本
秉承TradingView的精神,该脚本的作者将其开源,以便交易者可以查看和验证其功能。向作者致敬!您可以免费使用该脚本,但请记住,重新发布代码须遵守我们的网站规则。
免责声明
这些信息和出版物并非旨在提供,也不构成TradingView提供或认可的任何形式的财务、投资、交易或其他类型的建议或推荐。请阅读使用条款了解更多信息。