OPEN-SOURCE SCRIPT
已更新 Ultimate Matrix HUD v8
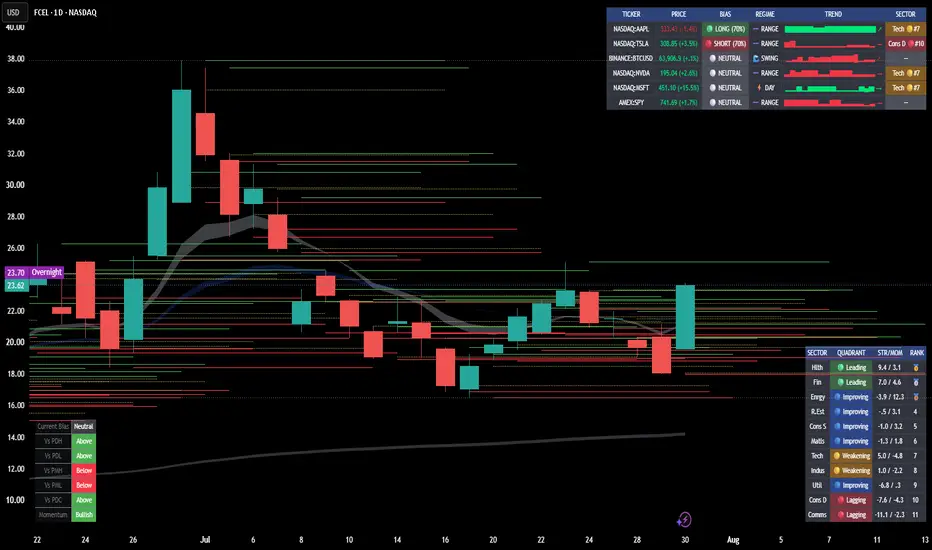
🎯 Ultimate Matrix HUD — Multi-Symbol Direction + Sector Rotation Dashboard
What it is: An all-in-one heads-up display that answers three questions at a glance — Which way is my stock going? How much conviction is behind it? And is the money flowing into its sector? It scans up to 6 tickers of your choice plus ranks all 11 market sectors, right on your chart. Built for desktop and phone.
📊 What You're Looking At
The HUD has two panels:
1️⃣ Watchlist Panel — your 6 chosen tickers, one row each:
Column Meaning
TICKER The symbol being scanned
BIAS Direction + conviction: 🟢 LONG / 🔴 SHORT (strong, ≥70%), 🟡 WEAK L/S (building, 40–69%), ⚪ NEUTRAL
REGIME Market character: ⚡ DAY (volatile/intraday), 🌊 SWING (calm/trending), ➖ RANGE (chop)
TREND A mini score-history sparkline (▁▂▃▄▅▆▇█) with an arrow — ↗ = conviction strengthening, → = flat/fading
SECTOR The ticker's sector, its live rotation quadrant color, and rank (e.g. Tech 🟢#2)
2️⃣ Sector Rotation Panel — all 11 sectors ranked by relative strength:
Column Meaning
SECTOR Short label (Tech, Fin, Enrgy, Hlth, etc.)
QUADRANT 🟢 Leading, 🟡 Weakening, 🔴 Lagging, 🔵 Improving
STR/MOM The two RRG axes — Strength / Momentum
RANK Position 1–11, with 🥇🥈🥉 for the top three
🧠 How the Bias Score Works
Each ticker is graded 0–100% on four pillars:
Macro Trend (40 pts) — Higher-timeframe EMA structure (fast vs slow) confirms the big-picture direction.
Momentum (30 pts) — RSI in the healthy trend zone (not overextended).
Volume Confirmation (30 pts) — A volume spike in the direction of the move = real participation.
A score of ≥70% lights up 🟢 LONG or 🔴 SHORT. Between 40–69% it's a building 🟡 WEAK signal. Below that, ⚪ NEUTRAL.
🔄 How Sector Rotation Works (RRG Model)
Every sector is measured against a benchmark (default SPY, fully customizable) on two axes:
Strength — is it outperforming the benchmark over the long window?
Momentum — is that outperformance accelerating or fading?
Those two combine into the classic Relative Rotation Graph quadrants:
Quadrant Meaning Play
🟢 Leading Strong and accelerating Prime hunting ground for longs
🟡 Weakening Strong but losing steam Take profits / tighten stops
🔴 Lagging Weak and still falling Avoid longs / short candidates
🔵 Improving Weak but turning up Early rotation — watchlist for entries
Money typically rotates clockwise: Improving → Leading → Weakening → Lagging.
The STR/MOM column shows the two raw axes (e.g. 3.2 / 1.1 = outperforming and accelerating). Classic rotation flow is clockwise: Improving → Leading → Weakening → Lagging.
✅ The A+ Setup — Reading a Row in One Glance
The whole point is confluence. Your strongest trade lines up all three:
text
Copy
🟢 LONG (100%) + ▇█ ↗ + Tech 🟢#1
direction conviction money flow
That's a strong signal, still strengthening, in the #1 leading sector. Conversely, a 🟢 LONG whose sector reads 🔴#10 is a red flag — you'd be fighting the rotation.
⚙️ Setup (One-Time, ~2 Minutes)
Watchlist: Enter your 6 tickers and pick each one's sector from the dropdown. Set crypto/forex to None (their sector tag will show —).
Benchmark: Default SPY. Swap to QQQ (tech-relative), IWM (small-cap), or any symbol.
Mode: Choose Watchlist, Sector Rotation, or Both.
Display: Position, text size, transparency, colors, borders, and toggle any column on/off.
⚠️ Sector assignment is manual — Pine Script can't reliably auto-detect a stock's sector for scanned symbols. It's a 30-second, one-time setup and gives you 100% accurate, self-controlled tagging.
🔔 Discord Alerts (Optional)
The HUD can push formatted alerts to Discord on two events:
Bias Flip — a ticker crosses into 🟢 LONG or 🔴 SHORT
Momentum Strengthening — conviction starts accelerating (↗)
Each alert includes the ticker, bias, regime, trend, and its sector context:
text
Copy
NASDAQ:AAPL
Bias: 🟢 LONG (100%)
Regime: ⚡ DAY
Trend: ▇█ ↗
Sector: Tech 🟢#2
To wire it up:
In Discord: Server Settings → Integrations → Webhooks → New Webhook, copy the URL.
In TradingView: click the alarm clock ⏰ → Create Alert on this indicator.
Set Condition = Ultimate Matrix HUD, and under Notifications → Webhook URL, paste your Discord webhook.
Set the alert message to {{plot}} or leave default — the indicator sends its own JSON payload.
Alerts fire on bar close for reliability (no repaint-driven false pings).
📱 Mobile Tips
Set Text Size = Tiny/Small and bump Panel Transparency so price stays visible.
Hide columns you don't need (Regime, Trend, or Sector) to slim the panel.
Use Watchlist-only mode on phone for the cleanest view; switch to Both on desktop.
⚠️ Important Notes & Limitations
Live-bar values are provisional. All scores, ranks, and quadrants settle on bar close — treat the forming bar as an estimate.
Not financial advice. This is a decision-support dashboard, not a signal-to-blindly-trade. Always confirm with your own analysis and risk management.
Sector features are equity-focused. Set non-equity symbols (crypto/forex) to None.
Best on liquid symbols with real volume data — thinly traded names may give noisy volume/regime reads.
Timeframe: Works on any, but shines on 15m–4H for swing/intraday. Benchmark & windows are fully tunable in settings.
What it is: An all-in-one heads-up display that answers three questions at a glance — Which way is my stock going? How much conviction is behind it? And is the money flowing into its sector? It scans up to 6 tickers of your choice plus ranks all 11 market sectors, right on your chart. Built for desktop and phone.
📊 What You're Looking At
The HUD has two panels:
1️⃣ Watchlist Panel — your 6 chosen tickers, one row each:
Column Meaning
TICKER The symbol being scanned
BIAS Direction + conviction: 🟢 LONG / 🔴 SHORT (strong, ≥70%), 🟡 WEAK L/S (building, 40–69%), ⚪ NEUTRAL
REGIME Market character: ⚡ DAY (volatile/intraday), 🌊 SWING (calm/trending), ➖ RANGE (chop)
TREND A mini score-history sparkline (▁▂▃▄▅▆▇█) with an arrow — ↗ = conviction strengthening, → = flat/fading
SECTOR The ticker's sector, its live rotation quadrant color, and rank (e.g. Tech 🟢#2)
2️⃣ Sector Rotation Panel — all 11 sectors ranked by relative strength:
Column Meaning
SECTOR Short label (Tech, Fin, Enrgy, Hlth, etc.)
QUADRANT 🟢 Leading, 🟡 Weakening, 🔴 Lagging, 🔵 Improving
STR/MOM The two RRG axes — Strength / Momentum
RANK Position 1–11, with 🥇🥈🥉 for the top three
🧠 How the Bias Score Works
Each ticker is graded 0–100% on four pillars:
Macro Trend (40 pts) — Higher-timeframe EMA structure (fast vs slow) confirms the big-picture direction.
Momentum (30 pts) — RSI in the healthy trend zone (not overextended).
Volume Confirmation (30 pts) — A volume spike in the direction of the move = real participation.
A score of ≥70% lights up 🟢 LONG or 🔴 SHORT. Between 40–69% it's a building 🟡 WEAK signal. Below that, ⚪ NEUTRAL.
🔄 How Sector Rotation Works (RRG Model)
Every sector is measured against a benchmark (default SPY, fully customizable) on two axes:
Strength — is it outperforming the benchmark over the long window?
Momentum — is that outperformance accelerating or fading?
Those two combine into the classic Relative Rotation Graph quadrants:
Quadrant Meaning Play
🟢 Leading Strong and accelerating Prime hunting ground for longs
🟡 Weakening Strong but losing steam Take profits / tighten stops
🔴 Lagging Weak and still falling Avoid longs / short candidates
🔵 Improving Weak but turning up Early rotation — watchlist for entries
Money typically rotates clockwise: Improving → Leading → Weakening → Lagging.
The STR/MOM column shows the two raw axes (e.g. 3.2 / 1.1 = outperforming and accelerating). Classic rotation flow is clockwise: Improving → Leading → Weakening → Lagging.
✅ The A+ Setup — Reading a Row in One Glance
The whole point is confluence. Your strongest trade lines up all three:
text
Copy
🟢 LONG (100%) + ▇█ ↗ + Tech 🟢#1
direction conviction money flow
That's a strong signal, still strengthening, in the #1 leading sector. Conversely, a 🟢 LONG whose sector reads 🔴#10 is a red flag — you'd be fighting the rotation.
⚙️ Setup (One-Time, ~2 Minutes)
Watchlist: Enter your 6 tickers and pick each one's sector from the dropdown. Set crypto/forex to None (their sector tag will show —).
Benchmark: Default SPY. Swap to QQQ (tech-relative), IWM (small-cap), or any symbol.
Mode: Choose Watchlist, Sector Rotation, or Both.
Display: Position, text size, transparency, colors, borders, and toggle any column on/off.
⚠️ Sector assignment is manual — Pine Script can't reliably auto-detect a stock's sector for scanned symbols. It's a 30-second, one-time setup and gives you 100% accurate, self-controlled tagging.
🔔 Discord Alerts (Optional)
The HUD can push formatted alerts to Discord on two events:
Bias Flip — a ticker crosses into 🟢 LONG or 🔴 SHORT
Momentum Strengthening — conviction starts accelerating (↗)
Each alert includes the ticker, bias, regime, trend, and its sector context:
text
Copy
NASDAQ:AAPL
Bias: 🟢 LONG (100%)
Regime: ⚡ DAY
Trend: ▇█ ↗
Sector: Tech 🟢#2
To wire it up:
In Discord: Server Settings → Integrations → Webhooks → New Webhook, copy the URL.
In TradingView: click the alarm clock ⏰ → Create Alert on this indicator.
Set Condition = Ultimate Matrix HUD, and under Notifications → Webhook URL, paste your Discord webhook.
Set the alert message to {{plot}} or leave default — the indicator sends its own JSON payload.
Alerts fire on bar close for reliability (no repaint-driven false pings).
📱 Mobile Tips
Set Text Size = Tiny/Small and bump Panel Transparency so price stays visible.
Hide columns you don't need (Regime, Trend, or Sector) to slim the panel.
Use Watchlist-only mode on phone for the cleanest view; switch to Both on desktop.
⚠️ Important Notes & Limitations
Live-bar values are provisional. All scores, ranks, and quadrants settle on bar close — treat the forming bar as an estimate.
Not financial advice. This is a decision-support dashboard, not a signal-to-blindly-trade. Always confirm with your own analysis and risk management.
Sector features are equity-focused. Set non-equity symbols (crypto/forex) to None.
Best on liquid symbols with real volume data — thinly traded names may give noisy volume/regime reads.
Timeframe: Works on any, but shines on 15m–4H for swing/intraday. Benchmark & windows are fully tunable in settings.
版本注释
Release Notes / Changelogv8 — Foundation (initial public release)
• 6-slot Watchlist HUD with the 4-pillar bias engine and tiered LONG/SHORT/WEAK/NEUTRAL scoring.
• REGIME, TREND (sparkline + strengthening arrow), and SECTOR context columns.
• Sector Rotation panel — 11 SPDR ETFs ranked by full RRG quadrant model vs. a customizable benchmark.
• Mode toggle (Watchlist / Sector Rotation / Both) and Discord alerts on bias flip + momentum strengthening.
• Full display customization; disciplined no-nested-request.security architecture.
v9 — Price, Compact & Cooldown
• 💲 Live Price column — magnitude-aware precision; colored green/red by change; zero new data requests.
• 📱 Compact Mode — one toggle collapses the HUD to Ticker · Price · Bias in tiny text.
• 🔕 Alert Cooldown — minimum bars between alerts per ticker (0 = off).
• 📨 Richer Discord alerts — payload now includes live price alongside bias, regime, trend, and sector.
v9.1 — Daily % + Guided Setup
• 📊 Bar / Day % change toggle — price change reads intrabar (vs. previous bar close, no extra data) or true session change (vs. prior daily close, guarded).
• 💬 Quick-start tooltips added throughout settings — Mode, sector tags, HTF, sparkline, and both rotation windows.
• 🗺️ In-script sector cheat-sheet mapping default tickers + common swaps to their correct sector inputs.
• Discord payload and price coloring stay in sync with the selected % basis.
v9.2 — Independent Sector Timeframe
• 🔒 Rotation Timeframe input — the sector rotation scan can now be locked to a fixed timeframe (default Daily) independent of your chart. Leave blank to follow the chart like before.
• 🧱 History integrity — RS-Ratio/RS-Mom windows now advance once per rotation bar (via timeframe.change), so a "60-bar" window means 60 true days, not 60 chart bars.
• 🛡️ Non-repainting rotation — daily RS values commit on the daily close, so intraday sector reads stay stable through the session.
• Watchlist bias engine still follows the chart timeframe for entry timing.
开源脚本
秉承TradingView的精神,该脚本的作者将其开源,以便交易者可以查看和验证其功能。向作者致敬!您可以免费使用该脚本,但请记住,重新发布代码须遵守我们的网站规则。

You can always take more, you can never take less.
免责声明
这些信息和出版物并非旨在提供,也不构成TradingView提供或认可的任何形式的财务、投资、交易或其他类型的建议或推荐。请阅读使用条款了解更多信息。
开源脚本
秉承TradingView的精神,该脚本的作者将其开源,以便交易者可以查看和验证其功能。向作者致敬!您可以免费使用该脚本,但请记住,重新发布代码须遵守我们的网站规则。
You can always take more, you can never take less.
免责声明
这些信息和出版物并非旨在提供,也不构成TradingView提供或认可的任何形式的财务、投资、交易或其他类型的建议或推荐。请阅读使用条款了解更多信息。