已更新
RSI T-Bands
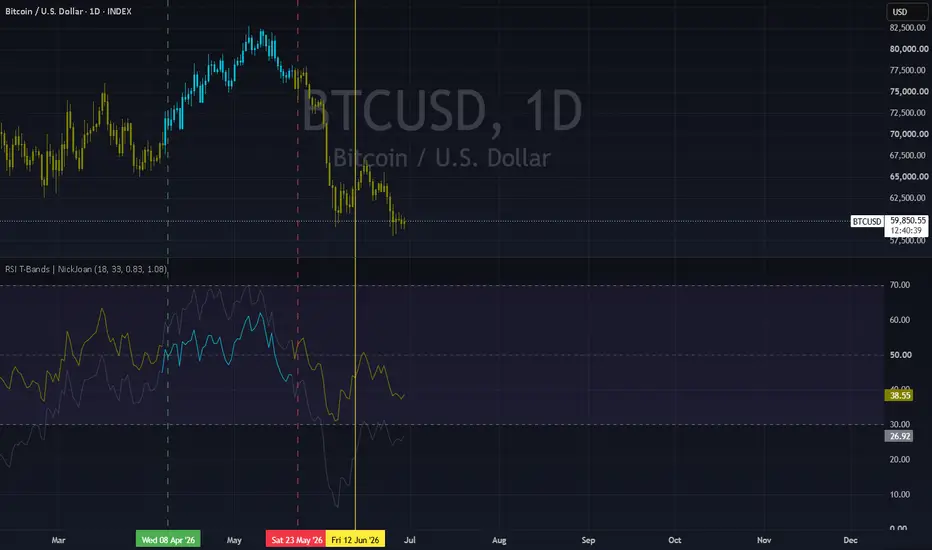
Overview
RSI T-Bands is a trend-following indicator that wraps RSI with upper and lower bands built from standard deviation. Instead of treating RSI as a simple overbought/oversold oscillator, it uses the position of these bands relative to the 50 midline to define a bullish or bearish trend state. Bands expand and contract with RSI volatility, making the indicator adaptive to changing momentum conditions.
• Bullish state: begins when the lower RSI band moves above 50.
• Bearish state: begins when the upper RSI band moves below 50
How to use
Candle coloring reflects the current trend state (green = bullish, red = bearish).
The upper and lower RSI bands act as dynamic thresholds around RSI.
The dashed 50 midline is the trend decision boundary.
Alerts
The script includes two alert conditions:
RSI T-Bands Bullish: triggers when the trend state flips from bearish to bullish.
RSI T-Bands Bearish: triggers when the trend state flips from bullish to bearish.
RSI T-Bands is a trend-following indicator that wraps RSI with upper and lower bands built from standard deviation. Instead of treating RSI as a simple overbought/oversold oscillator, it uses the position of these bands relative to the 50 midline to define a bullish or bearish trend state. Bands expand and contract with RSI volatility, making the indicator adaptive to changing momentum conditions.
• Bullish state: begins when the lower RSI band moves above 50.
• Bearish state: begins when the upper RSI band moves below 50
How to use
Candle coloring reflects the current trend state (green = bullish, red = bearish).
The upper and lower RSI bands act as dynamic thresholds around RSI.
The dashed 50 midline is the trend decision boundary.
Alerts
The script includes two alert conditions:
RSI T-Bands Bullish: triggers when the trend state flips from bearish to bullish.
RSI T-Bands Bearish: triggers when the trend state flips from bullish to bearish.
版本注释
Added separate upper and lower standard deviation multipliers.版本注释
Changed bar coloring.
免责声明
这些信息和出版物并非旨在提供,也不构成TradingView提供或认可的任何形式的财务、投资、交易或其他类型的建议或推荐。请阅读使用条款了解更多信息。