OPEN-SOURCE SCRIPT
Gann Eclipse Master 1900-2040 Santiago Rebello
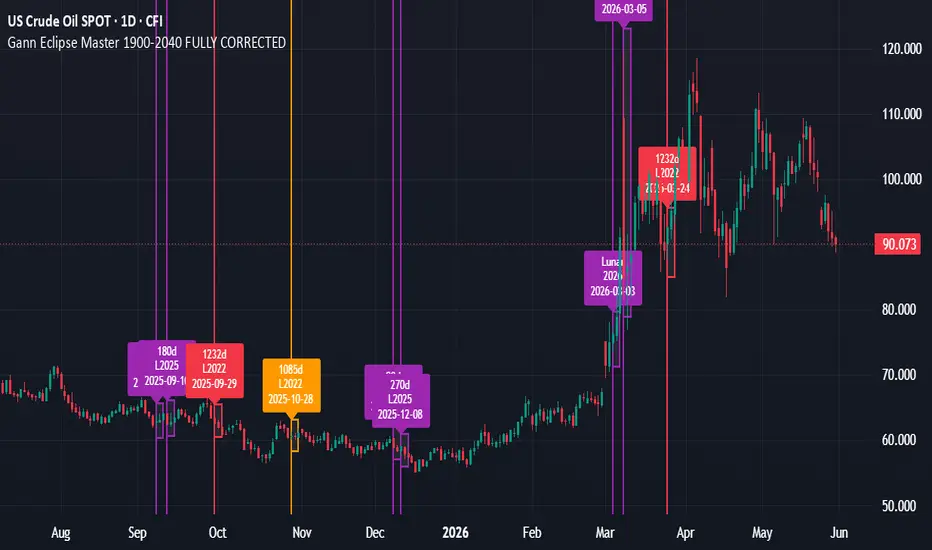
### Concept & Purpose
The Gann Eclipse Master is a historical mathematical astro-mapping engine built for financial market timing optimization. It catalogs major solar and lunar astronomical occurrences across an un-broken 140-year tracking grid (1900-2040) and applies specialized calendar-day offsets derived from classical financial geometry models to isolate key potential variance peaks.
### Why This Script is Unique (Originality & Usefulness)
This indicator bypasses standard price metrics entirely to address time-series trend structures. Instead of relying on manual date measurements, the indicator constructs an autonomous astronomical tracking engine:
1. **Hardcoded Data Database:** Rather than requesting erratic external dynamic server requests, it embeds historical astronomical epoch timestamps directly within compiled local variables.
2. **Harmonic Day Intervals:** From the point of any valid historical occurrence, the framework constructs advanced cycle extensions. It computes specific solar-interval vectors (+72d, +135d, +153d) and lunar-interval arcs (+90d, +180d, +270d) alongside long-term structural multipliers (+1085d, +1232d).
3. **Optimized Structural Projections:** By rendering vertical convergence windows across the timeline, it flags high-probability time zones where multiple independent astronomical projection vectors overlap on the same calendar area.
### How to Trade It
* **Convergence Clusters:** When multiple vertical lines align closely within a narrow bar group, the market is approaching a cyclical turnaround node. Look for structural candlestick reversals on these target days.
* **Astro Targets:** Use the dynamic labels to track the precise source year and cycle factor causing the current volatility expansion.
The Gann Eclipse Master is a historical mathematical astro-mapping engine built for financial market timing optimization. It catalogs major solar and lunar astronomical occurrences across an un-broken 140-year tracking grid (1900-2040) and applies specialized calendar-day offsets derived from classical financial geometry models to isolate key potential variance peaks.
### Why This Script is Unique (Originality & Usefulness)
This indicator bypasses standard price metrics entirely to address time-series trend structures. Instead of relying on manual date measurements, the indicator constructs an autonomous astronomical tracking engine:
1. **Hardcoded Data Database:** Rather than requesting erratic external dynamic server requests, it embeds historical astronomical epoch timestamps directly within compiled local variables.
2. **Harmonic Day Intervals:** From the point of any valid historical occurrence, the framework constructs advanced cycle extensions. It computes specific solar-interval vectors (+72d, +135d, +153d) and lunar-interval arcs (+90d, +180d, +270d) alongside long-term structural multipliers (+1085d, +1232d).
3. **Optimized Structural Projections:** By rendering vertical convergence windows across the timeline, it flags high-probability time zones where multiple independent astronomical projection vectors overlap on the same calendar area.
### How to Trade It
* **Convergence Clusters:** When multiple vertical lines align closely within a narrow bar group, the market is approaching a cyclical turnaround node. Look for structural candlestick reversals on these target days.
* **Astro Targets:** Use the dynamic labels to track the precise source year and cycle factor causing the current volatility expansion.
开源脚本
秉承TradingView的精神,该脚本的作者将其开源,以便交易者可以查看和验证其功能。向作者致敬!您可以免费使用该脚本,但请记住,重新发布代码须遵守我们的网站规则。

免责声明
这些信息和出版物并非旨在提供,也不构成TradingView提供或认可的任何形式的财务、投资、交易或其他类型的建议或推荐。请阅读使用条款了解更多信息。
开源脚本
秉承TradingView的精神,该脚本的作者将其开源,以便交易者可以查看和验证其功能。向作者致敬!您可以免费使用该脚本,但请记住,重新发布代码须遵守我们的网站规则。
免责声明
这些信息和出版物并非旨在提供,也不构成TradingView提供或认可的任何形式的财务、投资、交易或其他类型的建议或推荐。请阅读使用条款了解更多信息。