OPEN-SOURCE SCRIPT
Stock Position Sizer with Daily ATR
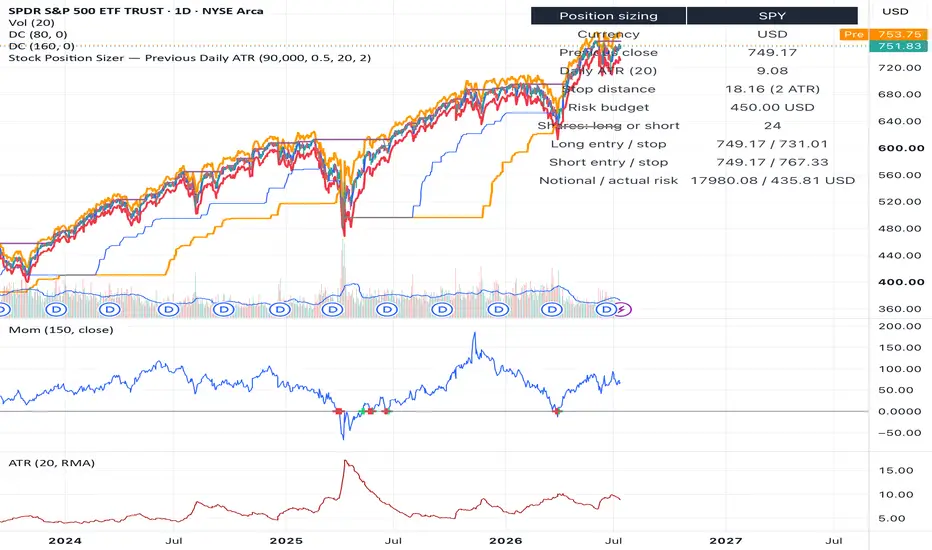
The script is a stock position-sizing indicator based on ATR multiples. It calculates how many whole shares you can trade while risking a chosen percentage of your nominal equity.
With the defaults:
- Nominal equity: 90,000
- Risk: 0.5%
- Risk budget: 450
- ATR length: 20 days
- Stop distance: 2 × ATR
### Calculation
It retrieves the close and ATR from the last completed daily bar, regardless of the chart timeframe.
Risk budget = Nominal equity × Risk percentage
Stop distance = Daily ATR × ATR multiple
Shares = floor(Risk budget ÷ Stop distance)
For example, if ATR is 8.86:
Risk budget = 90,000 × 0.5% = 450
Stop distance = 8.86 × 2 = 17.72
Position size = floor(450 ÷ 17.72) = 25 shares
Long and short levels
Both directions use the same share quantity because their stop distances are symmetrical:
Long entry = Previous daily close
Long stop = Previous daily close − 2 ATR
Short entry = Previous daily close
Short stop = Previous daily close + 2 ATR
What it displays
The chart shows three horizontal levels:
- Blue: previous daily close and assumed entry
- Red: long stop
- Orange: short stop
The table shows:
- Stock currency
- Previous daily close
- Daily ATR
- Stop distance
- Risk budget
- Number of whole shares
- Long entry and stop
- Short entry and stop
- Position notional and actual risk after rounding
There is no currency conversion. A value of `90,000` means $90,000 on a USD stock, €90,000 on a EUR stock, and so forth.
With the defaults:
- Nominal equity: 90,000
- Risk: 0.5%
- Risk budget: 450
- ATR length: 20 days
- Stop distance: 2 × ATR
### Calculation
It retrieves the close and ATR from the last completed daily bar, regardless of the chart timeframe.
Risk budget = Nominal equity × Risk percentage
Stop distance = Daily ATR × ATR multiple
Shares = floor(Risk budget ÷ Stop distance)
For example, if ATR is 8.86:
Risk budget = 90,000 × 0.5% = 450
Stop distance = 8.86 × 2 = 17.72
Position size = floor(450 ÷ 17.72) = 25 shares
Long and short levels
Both directions use the same share quantity because their stop distances are symmetrical:
Long entry = Previous daily close
Long stop = Previous daily close − 2 ATR
Short entry = Previous daily close
Short stop = Previous daily close + 2 ATR
What it displays
The chart shows three horizontal levels:
- Blue: previous daily close and assumed entry
- Red: long stop
- Orange: short stop
The table shows:
- Stock currency
- Previous daily close
- Daily ATR
- Stop distance
- Risk budget
- Number of whole shares
- Long entry and stop
- Short entry and stop
- Position notional and actual risk after rounding
There is no currency conversion. A value of `90,000` means $90,000 on a USD stock, €90,000 on a EUR stock, and so forth.
开源脚本
秉承TradingView的精神,该脚本的作者将其开源,以便交易者可以查看和验证其功能。向作者致敬!您可以免费使用该脚本,但请记住,重新发布代码须遵守我们的网站规则。

免责声明
这些信息和出版物并非旨在提供,也不构成TradingView提供或认可的任何形式的财务、投资、交易或其他类型的建议或推荐。请阅读使用条款了解更多信息。
免责声明
这些信息和出版物并非旨在提供,也不构成TradingView提供或认可的任何形式的财务、投资、交易或其他类型的建议或推荐。请阅读使用条款了解更多信息。