OPEN-SOURCE SCRIPT
RSI + SMA Crossover Gradient MTF Table
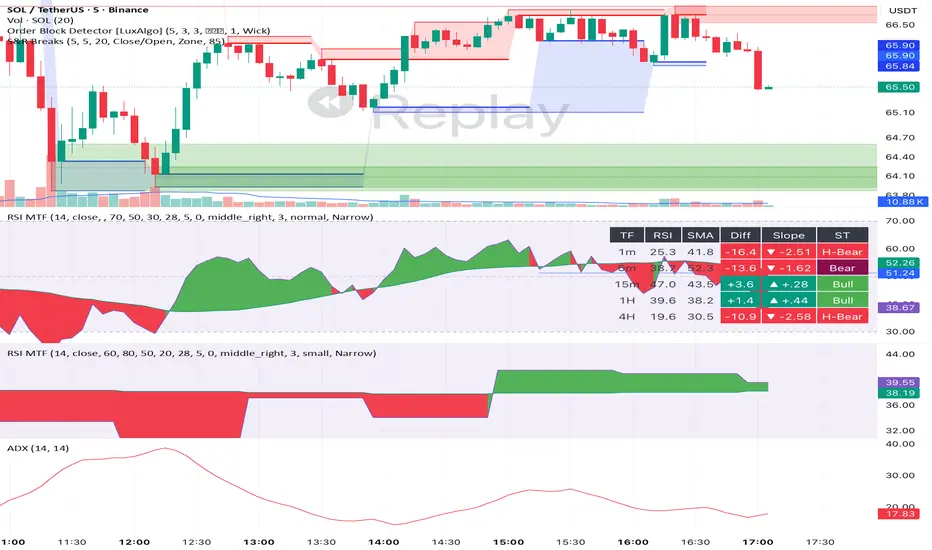
A multi-timeframe RSI indicator with SMA smoothing, crossover gradient fill, and a live MTF table.
FEATURES:
- RSI with custom SMA smoothing line
- Crossover Gradient Fill — color darkens as RSI moves away from cross point (bullish/bearish)
- MTF Table showing 1m, 5m, 15m, 1H, 4H timeframes simultaneously
- Each row shows: RSI value, SMA value, Diff (RSI−SMA), Slope direction, and Market State
- Market States: H-Bull, Bull, Bear, H-Bear based on RSI/SMA position relative to 50
- Table size adjustable (tiny to huge) — mobile friendly
- Table position fully customizable
HOW TO USE:
- RSI above SMA = Bullish momentum (green gradient)
- RSI below SMA = Bearish momentum (red gradient)
- H-Bull = Strong bull (both RSI & SMA above 50)
- H-Bear = Strong bear (both RSI & SMA below 50)
- Use MTF table to confirm trend across timeframes before entering a trade
FEATURES:
- RSI with custom SMA smoothing line
- Crossover Gradient Fill — color darkens as RSI moves away from cross point (bullish/bearish)
- MTF Table showing 1m, 5m, 15m, 1H, 4H timeframes simultaneously
- Each row shows: RSI value, SMA value, Diff (RSI−SMA), Slope direction, and Market State
- Market States: H-Bull, Bull, Bear, H-Bear based on RSI/SMA position relative to 50
- Table size adjustable (tiny to huge) — mobile friendly
- Table position fully customizable
HOW TO USE:
- RSI above SMA = Bullish momentum (green gradient)
- RSI below SMA = Bearish momentum (red gradient)
- H-Bull = Strong bull (both RSI & SMA above 50)
- H-Bear = Strong bear (both RSI & SMA below 50)
- Use MTF table to confirm trend across timeframes before entering a trade
开源脚本
秉承TradingView的精神,该脚本的作者将其开源,以便交易者可以查看和验证其功能。向作者致敬!您可以免费使用该脚本,但请记住,重新发布代码须遵守我们的网站规则。

免责声明
这些信息和出版物并非旨在提供,也不构成TradingView提供或认可的任何形式的财务、投资、交易或其他类型的建议或推荐。请阅读使用条款了解更多信息。
开源脚本
秉承TradingView的精神,该脚本的作者将其开源,以便交易者可以查看和验证其功能。向作者致敬!您可以免费使用该脚本,但请记住,重新发布代码须遵守我们的网站规则。
免责声明
这些信息和出版物并非旨在提供,也不构成TradingView提供或认可的任何形式的财务、投资、交易或其他类型的建议或推荐。请阅读使用条款了解更多信息。