OPEN-SOURCE SCRIPT
Bar Breakout with ATR
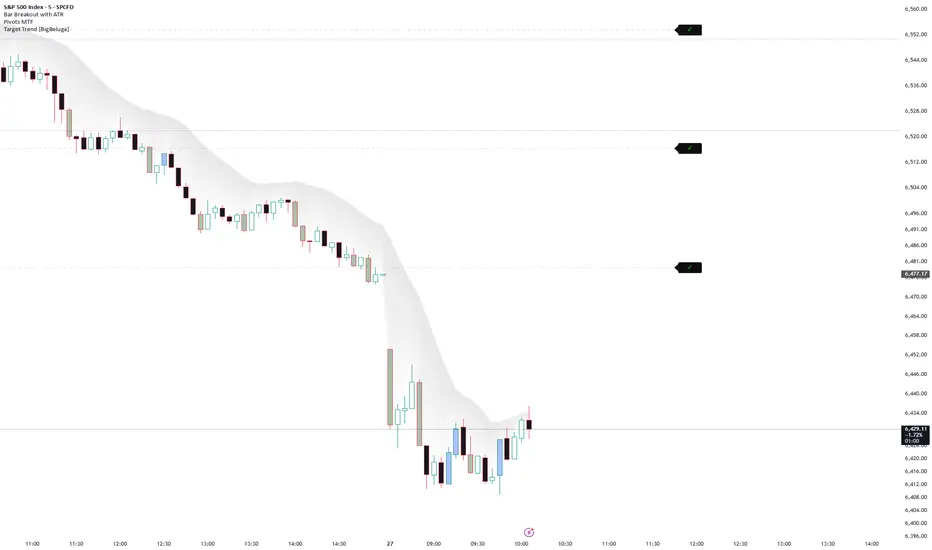
Bar Breakout with ATR — Multi-Timeframe Dashboard
Identifies high-quality breakout bars across multiple timeframes using a combination of ATR-based range filtering and IBS (Internal Bar Strength) confirmation.
How it works:
A bar is flagged as a breakout when three conditions align simultaneously — the close exceeds the prior bar's high (bull) or undercuts the prior bar's low (bear), the bar's range is at least N× the ATR, and the close quality is confirmed via IBS (top of range for bulls, bottom of range for bears). Bars that are large but fail to break are classified as POSS BULL or POSS BEAR — potential coiling setups worth watching.
Features:
Bar coloring — highlights confirmed breakout bars and large-range non-break bars in distinct colors
MTF Dashboard Table — shows the most recent breakout event (BULL BREAK, BEAR BREAK, POSS BULL, POSS BEAR) across up to 5 user-defined timeframes
Context rows — when the latest event on a timeframe is a POSS BULL/BEAR, the table optionally shows the last confirmed break for directional context
Per-bar detail — each table row displays timestamp (CST), low, high, range (with ATR multiple), midpoint, and IBS value
Fully configurable — ATR length, ATR multiplier, IBS thresholds, colors, table position, font sizes, and per-timeframe toggles
Best used on: Equity index futures (ES, NQ), ETFs, or any liquid instrument where breakout structure and range expansion are meaningful signals.
Identifies high-quality breakout bars across multiple timeframes using a combination of ATR-based range filtering and IBS (Internal Bar Strength) confirmation.
How it works:
A bar is flagged as a breakout when three conditions align simultaneously — the close exceeds the prior bar's high (bull) or undercuts the prior bar's low (bear), the bar's range is at least N× the ATR, and the close quality is confirmed via IBS (top of range for bulls, bottom of range for bears). Bars that are large but fail to break are classified as POSS BULL or POSS BEAR — potential coiling setups worth watching.
Features:
Bar coloring — highlights confirmed breakout bars and large-range non-break bars in distinct colors
MTF Dashboard Table — shows the most recent breakout event (BULL BREAK, BEAR BREAK, POSS BULL, POSS BEAR) across up to 5 user-defined timeframes
Context rows — when the latest event on a timeframe is a POSS BULL/BEAR, the table optionally shows the last confirmed break for directional context
Per-bar detail — each table row displays timestamp (CST), low, high, range (with ATR multiple), midpoint, and IBS value
Fully configurable — ATR length, ATR multiplier, IBS thresholds, colors, table position, font sizes, and per-timeframe toggles
Best used on: Equity index futures (ES, NQ), ETFs, or any liquid instrument where breakout structure and range expansion are meaningful signals.
开源脚本
秉承TradingView的精神,该脚本的作者将其开源,以便交易者可以查看和验证其功能。向作者致敬!您可以免费使用该脚本,但请记住,重新发布代码须遵守我们的网站规则。

免责声明
这些信息和出版物并非旨在提供,也不构成TradingView提供或认可的任何形式的财务、投资、交易或其他类型的建议或推荐。请阅读使用条款了解更多信息。
开源脚本
秉承TradingView的精神,该脚本的作者将其开源,以便交易者可以查看和验证其功能。向作者致敬!您可以免费使用该脚本,但请记住,重新发布代码须遵守我们的网站规则。
免责声明
这些信息和出版物并非旨在提供,也不构成TradingView提供或认可的任何形式的财务、投资、交易或其他类型的建议或推荐。请阅读使用条款了解更多信息。