Volume vs MA20 Multiple
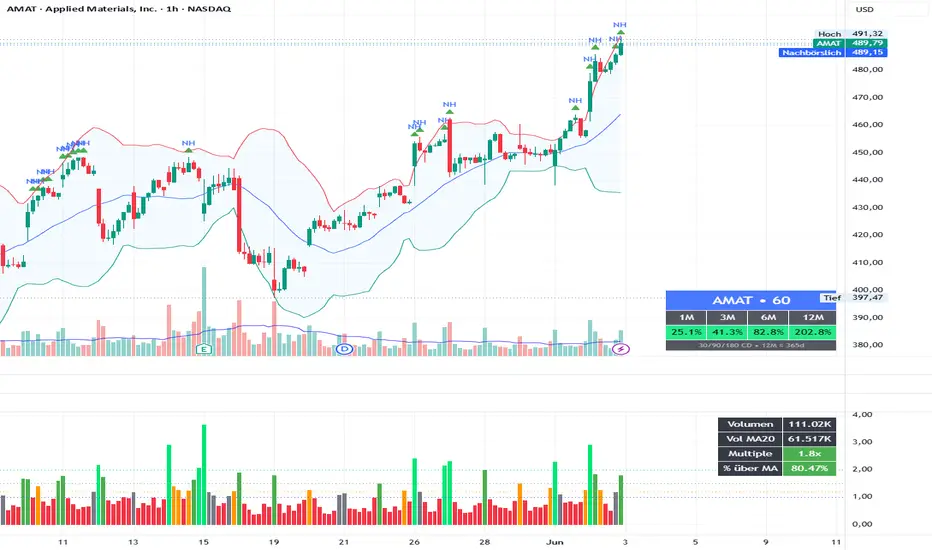
Volume vs MA20 Multiple
This indicator shows how the current candle’s volume compares to its moving average volume.
Instead of only displaying raw volume, it calculates a volume multiple relative to the selected volume moving average, for example:
The default setting uses a 20-period volume moving average, which means:
This makes it easier to judge whether a breakout, reversal, or pullback move is supported by meaningful volume.
How I use it
For breakout trades, I usually want to see price breaking above a key level while volume is clearly above average.
Typical interpretation:
The indicator can display both the multiple and the percentage above the moving average, making it useful for quickly validating whether a price move has real participation behind it.
This indicator is not a standalone buy or sell signal. It is intended to be used together with price action, support/resistance, trend structure, and risk management.
This indicator shows how the current candle’s volume compares to its moving average volume.
Instead of only displaying raw volume, it calculates a volume multiple relative to the selected volume moving average, for example:
- 1.0x = current volume equals the volume moving average
- 1.2x = current volume is 20% above average
- 1.5x = current volume is 50% above average
- 2.0x = current volume is twice the average volume
The default setting uses a 20-period volume moving average, which means:
- on the 1H chart, it compares the current hourly volume to the average of the last 20 hourly candles
- on the daily chart, it compares the current daily volume to the average of the last 20 daily candles
- on any timeframe, it automatically adapts to the selected chart timeframe
This makes it easier to judge whether a breakout, reversal, or pullback move is supported by meaningful volume.
How I use it
For breakout trades, I usually want to see price breaking above a key level while volume is clearly above average.
Typical interpretation:
- Below 1.0x: weak / below-average volume
- Around 1.0x: normal volume
- 1.2x – 1.5x: increased volume, potential confirmation
- 1.5x – 2.0x: strong volume confirmation
- Above 2.0x: very strong participation
The indicator can display both the multiple and the percentage above the moving average, making it useful for quickly validating whether a price move has real participation behind it.
- Best used for
- Breakout confirmation
- Pullback entries
- Reversal setups
- Intraday momentum analysis
- Comparing volume strength across different timeframes
This indicator is not a standalone buy or sell signal. It is intended to be used together with price action, support/resistance, trend structure, and risk management.

免责声明
这些信息和出版物并非旨在提供,也不构成TradingView提供或认可的任何形式的财务、投资、交易或其他类型的建议或推荐。请阅读使用条款了解更多信息。