UHV Reversal Boxes v6 - Live Extend + Fade On Break
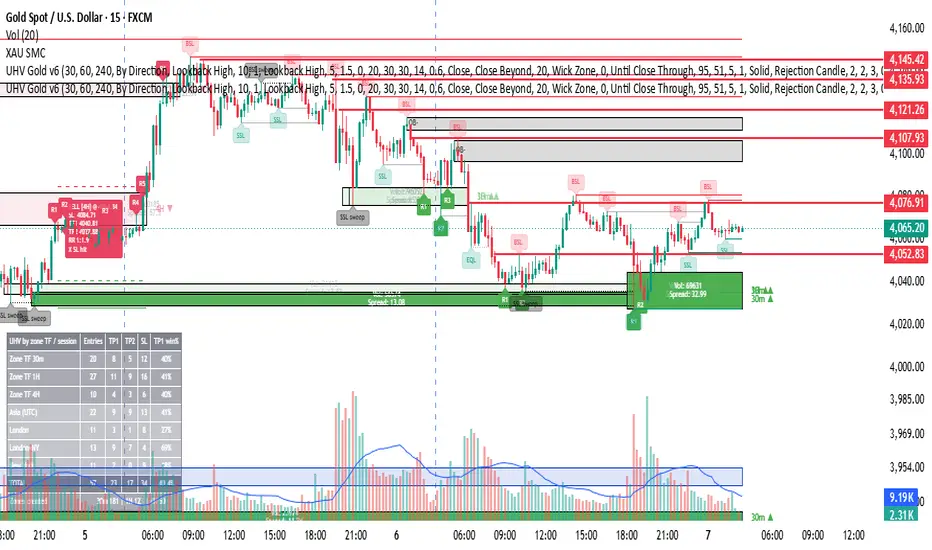
UHV Reversal Boxes v6 – Live Extend & Fade On Break
UHV (Ultra High Volume) Reversal Boxes is an analytical chart overlay indicator designed to identify and visualize key market structure reversal zones based on volume spikes and price action dynamics.
How It Works:
- High-Volume Zone Detection: Automatically identifies potential support and resistance zones where significant institutional volume spikes occur.
- Live Dynamic Extension: Projected reversal boxes dynamically extend live to the right as long as the identified price zone remains active and unmitigated.
- Automated Fading/Mitigation: Once price closes beyond or breaks the key reversal zone, the indicator automatically fades out or disables the box to maintain a clean chart presentation.
Key Features:
- Visual representation of high-volume rejection zones.
- Real-time box tracking to monitor liquidity and structural levels.
- Fully customizable parameters for volume sensitivity and display aesthetics.
How to Use:
1. Apply the indicator to your desired timeframe.
2. Monitor the active reversal boxes for potential liquidity sweeps, rejection candles, or structural confirmations.
3. Always align these visual zones with your independent analysis and risk management rules.
Note: Source code is open-source for community educational purposes.
Disclaimer: This tool is strictly for analytical purposes and does not constitute financial advice.
UHV (Ultra High Volume) Reversal Boxes is an analytical chart overlay indicator designed to identify and visualize key market structure reversal zones based on volume spikes and price action dynamics.
How It Works:
- High-Volume Zone Detection: Automatically identifies potential support and resistance zones where significant institutional volume spikes occur.
- Live Dynamic Extension: Projected reversal boxes dynamically extend live to the right as long as the identified price zone remains active and unmitigated.
- Automated Fading/Mitigation: Once price closes beyond or breaks the key reversal zone, the indicator automatically fades out or disables the box to maintain a clean chart presentation.
Key Features:
- Visual representation of high-volume rejection zones.
- Real-time box tracking to monitor liquidity and structural levels.
- Fully customizable parameters for volume sensitivity and display aesthetics.
How to Use:
1. Apply the indicator to your desired timeframe.
2. Monitor the active reversal boxes for potential liquidity sweeps, rejection candles, or structural confirmations.
3. Always align these visual zones with your independent analysis and risk management rules.
Note: Source code is open-source for community educational purposes.
Disclaimer: This tool is strictly for analytical purposes and does not constitute financial advice.

免责声明
这些信息和出版物并非旨在提供,也不构成TradingView提供或认可的任何形式的财务、投资、交易或其他类型的建议或推荐。请阅读使用条款了解更多信息。
免责声明
这些信息和出版物并非旨在提供,也不构成TradingView提供或认可的任何形式的财务、投资、交易或其他类型的建议或推荐。请阅读使用条款了解更多信息。