已更新
LDO-Magnet [1.1]
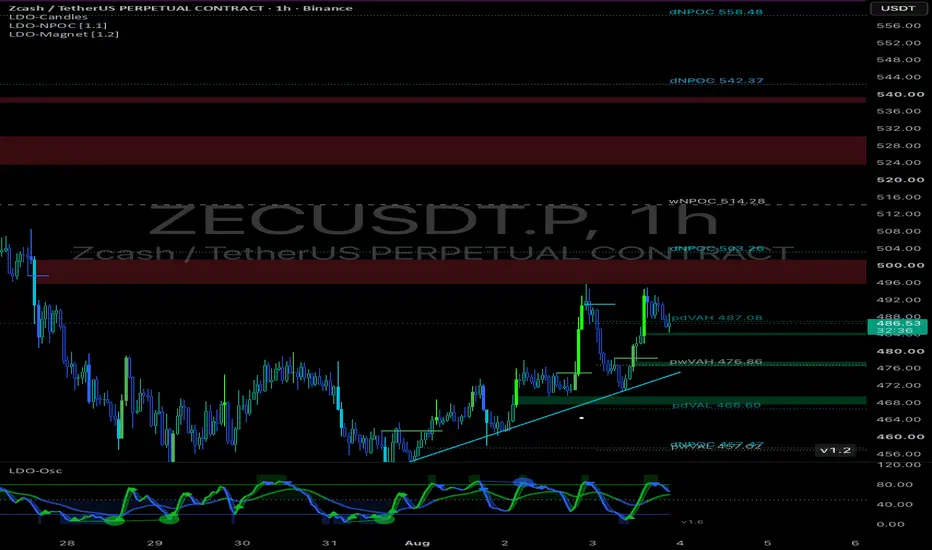
LDO-Magnet — Naked POCs, Value Areas & Vector Candle Zones
WHAT IT DOES
Plots the two kinds of unfinished business that pull price back like a magnet, and tells you when they stack on top of each other.
NAKED POINTS OF CONTROL (NPOCs). Each UTC day, week and month gets a volume profile built from lower-timeframe data. The price with the most traded volume is that period's POC. Once the period closes, an untouched POC is "naked" — a magnet that price tends to return to. Levels are removed the moment price finally trades through them. Previous Value Areas (VAH/VAL — the range holding 70% of the period's volume) are also drawn.
VECTOR CANDLE ZONES. Candles with unusually high volume — 200%+ of the recent average (red/green vectors) or 150%+ (violet/blue vectors) — mark where market makers left a footprint. The candle body becomes a zone that stays on the chart until price trades fully back through it.
CONFLUENCE ★. When a Naked POC sits inside an active vector zone, two independent reasons for price to react coincide at one level. The NPOC's label gains a star and its line brightens: ★ — the NPOC is anywhere inside the zone ★★ — the NPOC is near the zone's 50% midpoint (strong confluence) Stars appear and disappear live as zones are created and cleared.
READING THE CHART
Levels are labelled on the right edge: dNPOC / wNPOC / mNPOC are daily, weekly and monthly Naked POCs (dotted, dashed and solid lines); pdVAH, pwVAL etc. are the previous period's Value Area edges. A star in front of any NPOC means it currently sits inside a vector zone. When two NPOCs from different timeframes nearly overlap, only the higher-timeframe one is drawn — the hidden one is still tracked and still fires alerts.
SETTINGS
Timeframes — which profile periods to plot. Daily and weekly are on by default; monthly suits higher-timeframe charts.
Levels — toggle Naked POCs, previous Value Areas and developing (live, still-forming) profiles, and cap how many levels of each timeframe stay on the chart. "Keep Touched Levels" leaves a faded line where a level was hit instead of deleting it.
Vector Zones — toggle the zones, colour them with one colour or by vector type, and set their transparency. "Highlight NPOC + zone confluence" controls the stars; the "Strong confluence band" sets how close to the zone's 50% level an NPOC must be to earn ★★ (default 15% of the zone's height).
Display — labels, prices, text size, and the overlap distance below which lower-timeframe levels are hidden.
Alerts — enables the dynamic alerts and sets the approach distance.
Appearance — colours and transparency per level family. Transparency runs 0–100: LOWER is brighter, higher is fainter. If a label seems hard to read, check you are adjusting the slider for that family (Naked POC, Value Area or developing profile) — each has its own.
ALERTS
Add an alert on the indicator and choose a condition: approach/touch per NPOC timeframe, previous VAH/VAL crosses, Value Area entries, vector zone approach/entry, and Approaching/Touching Confluence. Or select "Any alert() function call" to receive everything as detailed messages, e.g.:
ZECUSDT.P | STRONG CONFLUENCE touch | Daily NPOC 466.60 inside vector zone | current 466.85
HOW TO USE THE CONFLUENCE
The stars mark where a reaction is likely — they do not predict its direction. In practice:
Treat ★★ levels as the highest-priority magnets on the chart. Price reaching one usually does something: a rejection back the way it came, or a decisive push straight through.
Read direction from the approach. Into confluence against the prevailing trend, favour the reversal; with the trend and on strong volume, a clean break often accelerates.
First touches are the most reliable. Once a level has been tested the magnet is spent — the script removes filled NPOCs automatically.
Higher timeframe beats lower: a starred wNPOC or mNPOC outranks a starred dNPOC.
Set the Approaching Confluence alert and let the chart come to you.
NOTES
Levels are computed from lower-timeframe volume distributed across price, with UTC period boundaries, so they will not exactly match profiles drawn in your chart's local timezone. Use standard candles. Works on any symbol and timeframe with volume data.
Vector zone logic is adapted from the open-source Vector Candle Zones code by infernix and peshocore (MPL 2.0) via the public Traders_Reality_Lib library — credit to them for the PVSRA methodology. The volume-profile engine, UTC framework, overlap suppression, confluence detection and alert system are original to this script.
WHAT IT DOES
Plots the two kinds of unfinished business that pull price back like a magnet, and tells you when they stack on top of each other.
NAKED POINTS OF CONTROL (NPOCs). Each UTC day, week and month gets a volume profile built from lower-timeframe data. The price with the most traded volume is that period's POC. Once the period closes, an untouched POC is "naked" — a magnet that price tends to return to. Levels are removed the moment price finally trades through them. Previous Value Areas (VAH/VAL — the range holding 70% of the period's volume) are also drawn.
VECTOR CANDLE ZONES. Candles with unusually high volume — 200%+ of the recent average (red/green vectors) or 150%+ (violet/blue vectors) — mark where market makers left a footprint. The candle body becomes a zone that stays on the chart until price trades fully back through it.
CONFLUENCE ★. When a Naked POC sits inside an active vector zone, two independent reasons for price to react coincide at one level. The NPOC's label gains a star and its line brightens: ★ — the NPOC is anywhere inside the zone ★★ — the NPOC is near the zone's 50% midpoint (strong confluence) Stars appear and disappear live as zones are created and cleared.
READING THE CHART
Levels are labelled on the right edge: dNPOC / wNPOC / mNPOC are daily, weekly and monthly Naked POCs (dotted, dashed and solid lines); pdVAH, pwVAL etc. are the previous period's Value Area edges. A star in front of any NPOC means it currently sits inside a vector zone. When two NPOCs from different timeframes nearly overlap, only the higher-timeframe one is drawn — the hidden one is still tracked and still fires alerts.
SETTINGS
Timeframes — which profile periods to plot. Daily and weekly are on by default; monthly suits higher-timeframe charts.
Levels — toggle Naked POCs, previous Value Areas and developing (live, still-forming) profiles, and cap how many levels of each timeframe stay on the chart. "Keep Touched Levels" leaves a faded line where a level was hit instead of deleting it.
Vector Zones — toggle the zones, colour them with one colour or by vector type, and set their transparency. "Highlight NPOC + zone confluence" controls the stars; the "Strong confluence band" sets how close to the zone's 50% level an NPOC must be to earn ★★ (default 15% of the zone's height).
Display — labels, prices, text size, and the overlap distance below which lower-timeframe levels are hidden.
Alerts — enables the dynamic alerts and sets the approach distance.
Appearance — colours and transparency per level family. Transparency runs 0–100: LOWER is brighter, higher is fainter. If a label seems hard to read, check you are adjusting the slider for that family (Naked POC, Value Area or developing profile) — each has its own.
ALERTS
Add an alert on the indicator and choose a condition: approach/touch per NPOC timeframe, previous VAH/VAL crosses, Value Area entries, vector zone approach/entry, and Approaching/Touching Confluence. Or select "Any alert() function call" to receive everything as detailed messages, e.g.:
ZECUSDT.P | STRONG CONFLUENCE touch | Daily NPOC 466.60 inside vector zone | current 466.85
HOW TO USE THE CONFLUENCE
The stars mark where a reaction is likely — they do not predict its direction. In practice:
Treat ★★ levels as the highest-priority magnets on the chart. Price reaching one usually does something: a rejection back the way it came, or a decisive push straight through.
Read direction from the approach. Into confluence against the prevailing trend, favour the reversal; with the trend and on strong volume, a clean break often accelerates.
First touches are the most reliable. Once a level has been tested the magnet is spent — the script removes filled NPOCs automatically.
Higher timeframe beats lower: a starred wNPOC or mNPOC outranks a starred dNPOC.
Set the Approaching Confluence alert and let the chart come to you.
NOTES
Levels are computed from lower-timeframe volume distributed across price, with UTC period boundaries, so they will not exactly match profiles drawn in your chart's local timezone. Use standard candles. Works on any symbol and timeframe with volume data.
Vector zone logic is adapted from the open-source Vector Candle Zones code by infernix and peshocore (MPL 2.0) via the public Traders_Reality_Lib library — credit to them for the PVSRA methodology. The volume-profile engine, UTC framework, overlap suppression, confluence detection and alert system are original to this script.
版本注释
DO-Magnet — Naked POCs, Value Areas & Vector Candle ZonesWHAT IT DOES
Plots the two kinds of unfinished business that pull price back like a magnet, and tells you when they stack on top of each other.
NAKED POINTS OF CONTROL (NPOCs). Each UTC day, week and month gets a volume profile built from lower-timeframe data. The price with the most traded volume is that period's POC. Once the period closes, an untouched POC is "naked" — a magnet that price tends to return to. Levels are removed the moment price finally trades through them. Previous Value Areas (VAH/VAL — the range holding 70% of the period's volume) are also drawn.
VECTOR CANDLE ZONES. Candles with unusually high volume — 200%+ of the recent average (red/green vectors) or 150%+ (violet/blue vectors) — mark where market makers left a footprint. The candle body becomes a zone that stays on the chart until price trades fully back through it.
CONFLUENCE ★. When a Naked POC sits inside an active vector zone, two independent reasons for price to react coincide at one level. The NPOC's label gains a star and its line brightens: ★ — the NPOC is anywhere inside the zone ★★ — the NPOC is near the zone's 50% midpoint (strong confluence) Stars appear and disappear live as zones are created and cleared.
READING THE CHART
Levels are labelled on the right edge: dNPOC / wNPOC / mNPOC are daily, weekly and monthly Naked POCs (dotted, dashed and solid lines); pdVAH, pwVAL etc. are the previous period's Value Area edges. A star in front of any NPOC means it currently sits inside a vector zone. When two NPOCs from different timeframes nearly overlap, only the higher-timeframe one is drawn — the hidden one is still tracked and still fires alerts.
SETTINGS
Timeframes — which profile periods to plot. Daily and weekly are on by default; monthly suits higher-timeframe charts.
Levels — toggle Naked POCs, previous Value Areas and developing (live, still-forming) profiles, and cap how many levels of each timeframe stay on the chart. "Keep Touched Levels" leaves a faded line where a level was hit instead of deleting it.
Vector Zones — toggle the zones, colour them with one colour or by vector type, and set their transparency. "Highlight NPOC + zone confluence" controls the stars; the "Strong confluence band" sets how close to the zone's 50% level an NPOC must be to earn ★★ (default 15% of the zone's height).
Display — labels, prices, text size, and the overlap distance below which lower-timeframe levels are hidden.
Alerts — enables the dynamic alerts and sets the approach distance.
Appearance — colours and transparency per level family. Transparency runs 0–100: LOWER is brighter, higher is fainter. If a label seems hard to read, check you are adjusting the slider for that family (Naked POC, Value Area or developing profile) — each has its own.
ALERTS
Add an alert on the indicator and choose a condition: approach/touch per NPOC timeframe, previous VAH/VAL crosses, Value Area entries, vector zone approach/entry, and Approaching/Touching Confluence. Or select "Any alert() function call" to receive everything as detailed messages, e.g.:
ZECUSDT.P | STRONG CONFLUENCE touch | Daily NPOC 466.60 inside vector zone | current 466.85
Every alert fires once per item — no repeats. An NPOC alerts at most twice in its life: once approaching, once on the touch that retires it. Value Area crosses and entries fire once per period per side, and each vector zone announces its approach and entry once.
HOW TO USE THE CONFLUENCE
The stars mark where a reaction is likely — they do not predict its direction. In practice:
Treat ★★ levels as the highest-priority magnets on the chart. Price reaching one usually does something: a rejection back the way it came, or a decisive push straight through.
Read direction from the approach. Into confluence against the prevailing trend, favour the reversal; with the trend and on strong volume, a clean break often accelerates.
First touches are the most reliable. Once a level has been tested the magnet is spent — the script removes filled NPOCs automatically.
Higher timeframe beats lower: a starred wNPOC or mNPOC outranks a starred dNPOC.
Set the Approaching Confluence alert and let the chart come to you.
NOTES
Levels are computed from lower-timeframe volume distributed across price, with UTC period boundaries, so they will not exactly match profiles drawn in your chart's local timezone. Use standard candles. Works on any symbol and timeframe with volume data.
Vector zone logic is adapted from the open-source Vector Candle Zones code by infernix and peshocore (MPL 2.0) via the public Traders_Reality_Lib library — credit to them for the PVSRA methodology. The volume-profile engine, UTC framework, overlap suppression, confluence detection and alert system are original to this script.

免责声明
这些信息和出版物并非旨在提供,也不构成TradingView提供或认可的任何形式的财务、投资、交易或其他类型的建议或推荐。请阅读使用条款了解更多信息。