Growth / Inflation Quadrant 2
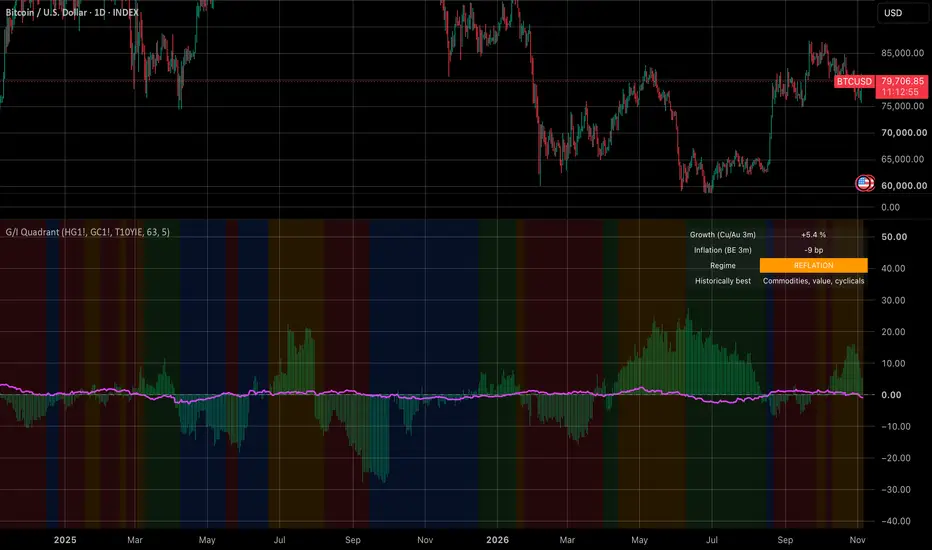
Growth / Inflation Quadrant – what this indicator does
This is a TradingView Pine Script (v6) indicator. It sorts the market into one of four macro regimes, using two market-based proxies in place of economic surprise data.
1. The two proxies
Growth = the 63-bar % change in the copper/gold ratio. Copper is a cyclical industrial metal and gold is a safe haven, so a rising ratio means the market is pricing in stronger growth.
Inflation = the 63-bar change in 10y breakeven inflation (FRED T10YIE), converted to basis points. FRED quotes it in percent, so multiplying by 100 gives bp.
63 trading days is about 3 months.
2. The four regimes
The signs of the two changes pick the regime:
- Growth up, inflation down = 1 GOLDILOCKS (green). Historically best for equities.
- Growth up, inflation up = 2 REFLATION (orange). Commodities, value, cyclicals.
- Growth down, inflation up = 3 STAGFLATION (red). Worst for both stocks and bonds.
- Growth down, inflation down = 4 DEFLATION / SLOWDOWN (blue). Government bonds do best.
3. Persistence filter
The regime only updates once the raw signal has been the same for N bars in a row (5 by default). Until then it keeps the old regime. This cuts down on flip-flopping when one of the proxies sits near zero. It starts in regime 4 (blue) until the first stable reading.
4. What you see on the chart
- Lime columns show the growth proxy in %.
- A fuchsia line shows the inflation proxy, divided by 10 so it fits on the same scale. A +50bp move plots as 5.
- The background is tinted in the regime colour.
- A table in the top-right corner shows the current values, the regime name, and what historically did best in that regime.
- An alert fires on the bar where the regime changes.
5. Things worth knowing
- Futures roll gaps. HG1! and GC1! are continuous front-month contracts. On roll dates the price can jump, and that jump flows into the 3-month change. Back-adjusted contracts are cleaner.
- Bars, not days. The lookback is 63 bars of whatever chart you're on. On a daily chart that's about 3 months. On a weekly chart it would be over a year, so use it on daily.
- FRED timing. Breakeven data comes in with a short lag and has holiday gaps, so the latest value can be a day stale. That doesn't matter for a 3-month signal.
- Zero counts as down. A change of exactly 0 is treated as falling, so flat markets land in regime 1 or 4.
- The proxies are noisy. Copper/gold also moves on China demand and on gold-specific flows such as central bank buying. Since 2022 that has pushed the ratio down for reasons that have little to do with global growth. The persistence filter helps with whipsaw, but not with a proxy that measures the wrong thing for a while.
In short: growth comes from metals, inflation from the bond market, and the regime from the signs of the two, with a hold filter on top. It's simple and transparent, which is the point.
This is a TradingView Pine Script (v6) indicator. It sorts the market into one of four macro regimes, using two market-based proxies in place of economic surprise data.
1. The two proxies
Growth = the 63-bar % change in the copper/gold ratio. Copper is a cyclical industrial metal and gold is a safe haven, so a rising ratio means the market is pricing in stronger growth.
Inflation = the 63-bar change in 10y breakeven inflation (FRED T10YIE), converted to basis points. FRED quotes it in percent, so multiplying by 100 gives bp.
63 trading days is about 3 months.
2. The four regimes
The signs of the two changes pick the regime:
- Growth up, inflation down = 1 GOLDILOCKS (green). Historically best for equities.
- Growth up, inflation up = 2 REFLATION (orange). Commodities, value, cyclicals.
- Growth down, inflation up = 3 STAGFLATION (red). Worst for both stocks and bonds.
- Growth down, inflation down = 4 DEFLATION / SLOWDOWN (blue). Government bonds do best.
3. Persistence filter
The regime only updates once the raw signal has been the same for N bars in a row (5 by default). Until then it keeps the old regime. This cuts down on flip-flopping when one of the proxies sits near zero. It starts in regime 4 (blue) until the first stable reading.
4. What you see on the chart
- Lime columns show the growth proxy in %.
- A fuchsia line shows the inflation proxy, divided by 10 so it fits on the same scale. A +50bp move plots as 5.
- The background is tinted in the regime colour.
- A table in the top-right corner shows the current values, the regime name, and what historically did best in that regime.
- An alert fires on the bar where the regime changes.
5. Things worth knowing
- Futures roll gaps. HG1! and GC1! are continuous front-month contracts. On roll dates the price can jump, and that jump flows into the 3-month change. Back-adjusted contracts are cleaner.
- Bars, not days. The lookback is 63 bars of whatever chart you're on. On a daily chart that's about 3 months. On a weekly chart it would be over a year, so use it on daily.
- FRED timing. Breakeven data comes in with a short lag and has holiday gaps, so the latest value can be a day stale. That doesn't matter for a 3-month signal.
- Zero counts as down. A change of exactly 0 is treated as falling, so flat markets land in regime 1 or 4.
- The proxies are noisy. Copper/gold also moves on China demand and on gold-specific flows such as central bank buying. Since 2022 that has pushed the ratio down for reasons that have little to do with global growth. The persistence filter helps with whipsaw, but not with a proxy that measures the wrong thing for a while.
In short: growth comes from metals, inflation from the bond market, and the regime from the signs of the two, with a hold filter on top. It's simple and transparent, which is the point.

免责声明
这些信息和出版物并非旨在提供,也不构成TradingView提供或认可的任何形式的财务、投资、交易或其他类型的建议或推荐。请阅读使用条款了解更多信息。