OI Candle by Umut
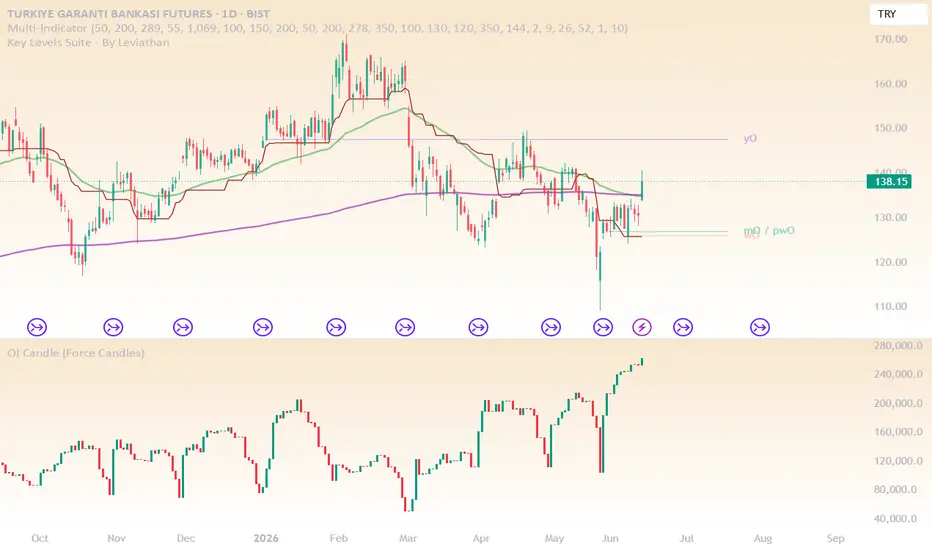
This indicator displays Open Interest (OI) as candlestick data across all timeframes, giving traders a clearer view of market participation and positioning dynamics.
Unlike standard OI indicators that use line charts or are limited to higher timeframes, this version visualizes OI using full OHLC candles. This allows you to analyze volatility, momentum, and structural changes in open interest in the same way as price action.
Unlike standard OI indicators that use line charts or are limited to higher timeframes, this version visualizes OI using full OHLC candles. This allows you to analyze volatility, momentum, and structural changes in open interest in the same way as price action.

免责声明
这些信息和出版物并非旨在提供,也不构成TradingView提供或认可的任何形式的财务、投资、交易或其他类型的建议或推荐。请阅读使用条款了解更多信息。
免责声明
这些信息和出版物并非旨在提供,也不构成TradingView提供或认可的任何形式的财务、投资、交易或其他类型的建议或推荐。请阅读使用条款了解更多信息。