已更新
COT+ (M1D)
COT+ (M1D)
Commitment of Traders report the way ICT teaches it: follow the commercials, and judge their net position against its own range, not against zero.
The commercials' net position
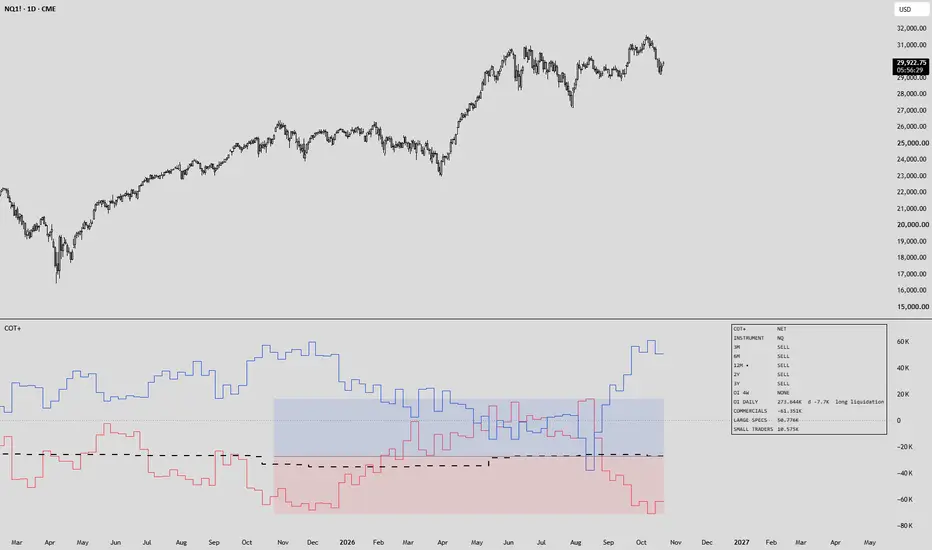
One red step line: commercial longs minus commercial shorts, from the weekly CFTC report (positions as of Tuesday, published Friday). The data refreshes on its own every week.
The range box
The box spans the lookback (12 months by default) from the commercials' lowest net to their highest. Its midline is the new zero line: (highest + lowest) / 2. Net above the midline = the commercials are in a buying program (upper half, blue). Net below it = a selling program (lower half, red).
Example: a 12-month high of 400K and a low of 160K put the midline at 280K. A net of 300K sits above it, so the read is BUY.
The table
The same test over 3 months, 6 months, 12 months, 2 years and 3 years, each one BUY or SELL. The window the box draws is marked. Hover any row for the midline and the range behind it. OI 4W is the open interest check: open interest down 10% or more while the commercials add = short covering (BULLISH); open interest up 10% or more while they sell = BEARISH; anything else = NONE.
Markets
COT exists for CFTC-reported futures only. The report is picked from the chart's symbol. On a CFD chart (NAS100, XAUUSD) set the futures contract in "Futures symbol", for example CME_MINI:NQ1! or COMEX:GC1!. Report = Auto switches to the Financial report for index, rate, FX and crypto futures and the Disaggregated report for commodities. Large Specs and Small Traders can be turned back on in Style, and Display = COT Index scales each net 0-100 over the lookback.
Disclaimer
This script is for education and chart analysis only. It is not financial advice and does not place trades. Past positioning does not predict future price.
Commitment of Traders report the way ICT teaches it: follow the commercials, and judge their net position against its own range, not against zero.
The commercials' net position
One red step line: commercial longs minus commercial shorts, from the weekly CFTC report (positions as of Tuesday, published Friday). The data refreshes on its own every week.
The range box
The box spans the lookback (12 months by default) from the commercials' lowest net to their highest. Its midline is the new zero line: (highest + lowest) / 2. Net above the midline = the commercials are in a buying program (upper half, blue). Net below it = a selling program (lower half, red).
Example: a 12-month high of 400K and a low of 160K put the midline at 280K. A net of 300K sits above it, so the read is BUY.
The table
The same test over 3 months, 6 months, 12 months, 2 years and 3 years, each one BUY or SELL. The window the box draws is marked. Hover any row for the midline and the range behind it. OI 4W is the open interest check: open interest down 10% or more while the commercials add = short covering (BULLISH); open interest up 10% or more while they sell = BEARISH; anything else = NONE.
Markets
COT exists for CFTC-reported futures only. The report is picked from the chart's symbol. On a CFD chart (NAS100, XAUUSD) set the futures contract in "Futures symbol", for example CME_MINI:NQ1! or COMEX:GC1!. Report = Auto switches to the Financial report for index, rate, FX and crypto futures and the Disaggregated report for commodities. Large Specs and Small Traders can be turned back on in Style, and Display = COT Index scales each net 0-100 over the lookback.
Disclaimer
This script is for education and chart analysis only. It is not financial advice and does not place trades. Past positioning does not predict future price.
版本注释
Source tidyTidied a comment in the source code. Nothing changes in how COT+ works, what it shows or its settings.

免责声明
这些信息和出版物并非旨在提供,也不构成TradingView提供或认可的任何形式的财务、投资、交易或其他类型的建议或推荐。请阅读使用条款了解更多信息。