Halo SOL-ETH 4H Scenario Map
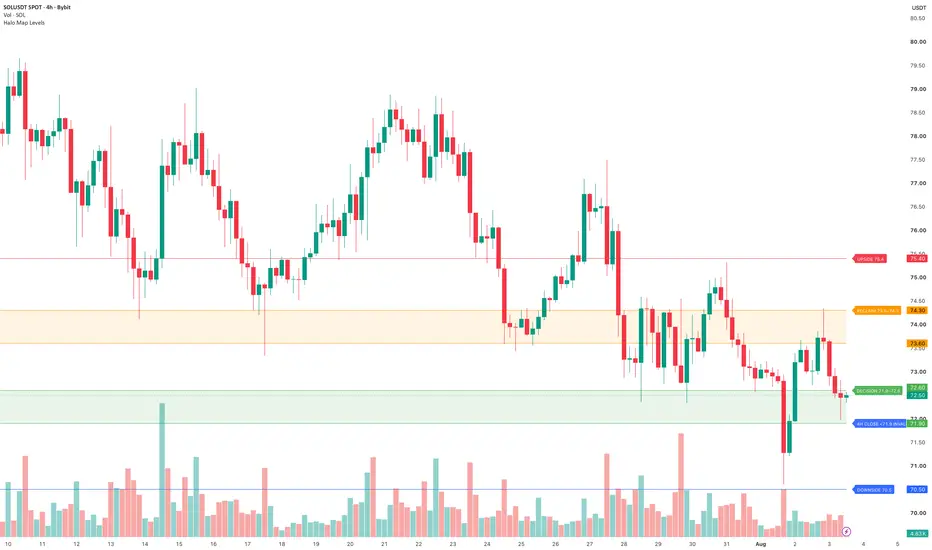
An open-source visual scenario map for the SOLUSDT and ETHUSDT 4-hour charts. It plots two transparent decision zones and the key upside, invalidation and downside levels used in the accompanying Halo market analysis.
SOL map: 71.9–72.6 decision zone, 73.6–74.3 reclaim zone, 75.4 upside and 70.5 downside after a 4H close below 71.9.
ETH map: 1,820–1,840 demand zone, 1,879–1,900 reclaim zone, 1,940 upside and 1,800 downside after a 4H close below 1,820.
The colors are intentionally simple: green for demand/decision, orange for reclaim, red for upside decision and blue for invalidation/downside. The script is a visual analysis aid only. It does not generate entries, execute trades or predict outcomes. Maps, not predictions.
SOL map: 71.9–72.6 decision zone, 73.6–74.3 reclaim zone, 75.4 upside and 70.5 downside after a 4H close below 71.9.
ETH map: 1,820–1,840 demand zone, 1,879–1,900 reclaim zone, 1,940 upside and 1,800 downside after a 4H close below 1,820.
The colors are intentionally simple: green for demand/decision, orange for reclaim, red for upside decision and blue for invalidation/downside. The script is a visual analysis aid only. It does not generate entries, execute trades or predict outcomes. Maps, not predictions.

免责声明
这些信息和出版物并非旨在提供,也不构成TradingView提供或认可的任何形式的财务、投资、交易或其他类型的建议或推荐。请阅读使用条款了解更多信息。
免责声明
这些信息和出版物并非旨在提供,也不构成TradingView提供或认可的任何形式的财务、投资、交易或其他类型的建议或推荐。请阅读使用条款了解更多信息。