OPEN-SOURCE SCRIPT
ZC Footprint Strategy FINAL (Long + Short)
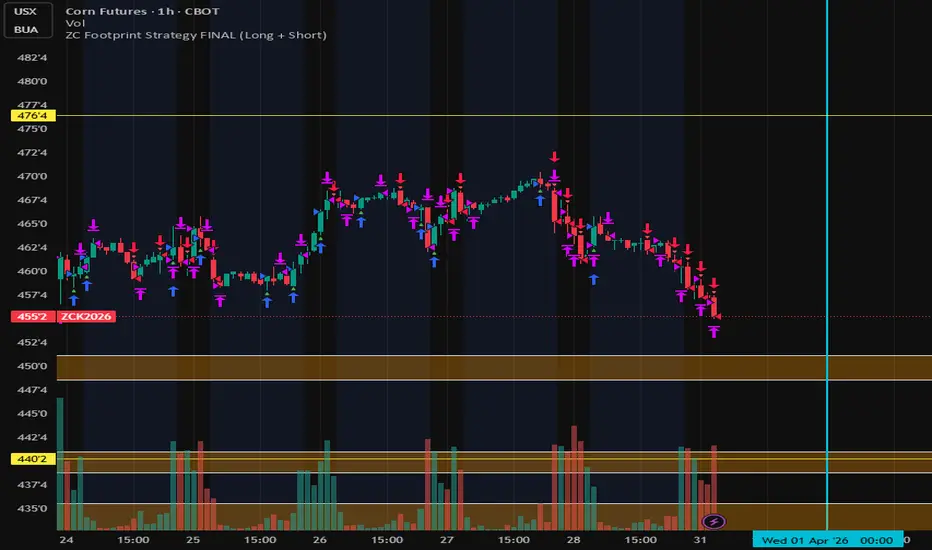
**Footprint Delta Futures Strategy**
The Footprint Delta Futures Strategy is a price-action and order flow–based trading approach designed to capture high-probability entries in the futures market by analyzing the imbalance between buyers and sellers at key levels. This strategy integrates footprint chart analysis, delta confirmation, and trend alignment to identify institutional activity and momentum shifts.
At its core, the strategy focuses on **delta**, which represents the difference between aggressive buying and selling pressure. By observing positive and negative delta at specific price levels, traders can detect whether buyers or sellers are in control. A strong positive delta suggests aggressive buyers lifting the offer, while a strong negative delta indicates sellers hitting the bid.
The strategy works best when combined with a higher timeframe trend filter, such as the EMA 50. Trades are only taken in the direction of the prevailing trend to increase probability and reduce noise. For example, long positions are considered when price is above the EMA 50 and supported by strong positive delta, while short positions are initiated when price is below the EMA 50 with confirming negative delta.
A key component of this strategy is identifying **footprint imbalances and absorption zones**. Imbalances occur when there is a significant difference between bid and ask volume at a price level, signaling potential continuation. Absorption, on the other hand, occurs when large opposing orders prevent price from moving further, often indicating a reversal or strong support/resistance level.
Entries are typically triggered when:
* Price breaks and closes above or below a key level (e.g., EMA 50 or structure level)
* Delta confirms the move with strong buying or selling pressure
* Footprint shows imbalance in the direction of the trade
Risk management is strictly enforced using predefined stop-loss levels, typically placed below recent structure for long trades and above structure for short trades. Take-profit levels can be set based on risk-to-reward ratios (e.g., 1:2 or 1:3) or key liquidity zones.
This strategy is particularly effective in highly liquid futures markets such as indices, commodities, and major contracts, where order flow data provides meaningful insight into market behavior. It is best suited for intraday traders who can actively monitor footprint charts and react to real-time market conditions.
Overall, the Footprint Delta Futures Strategy aims to provide traders with a structured, data-driven approach to understanding market participants’ behavior, improving entry timing, and enhancing trade confidence through order flow confirmation.
开源脚本
秉承TradingView的精神,该脚本的作者将其开源,以便交易者可以查看和验证其功能。向作者致敬!您可以免费使用该脚本,但请记住,重新发布代码须遵守我们的网站规则。

免责声明
这些信息和出版物并非旨在提供,也不构成TradingView提供或认可的任何形式的财务、投资、交易或其他类型的建议或推荐。请阅读使用条款了解更多信息。
开源脚本
秉承TradingView的精神,该脚本的作者将其开源,以便交易者可以查看和验证其功能。向作者致敬!您可以免费使用该脚本,但请记住,重新发布代码须遵守我们的网站规则。
免责声明
这些信息和出版物并非旨在提供,也不构成TradingView提供或认可的任何形式的财务、投资、交易或其他类型的建议或推荐。请阅读使用条款了解更多信息。